
Executive Summary
Venture capital metrics change shape as a company moves from Series A to Series E. Founders who miss that shift often pitch the right company with the wrong evidence. Early rounds test whether customers want the product, while later rounds test scale, cash generation, and the credibility of an exit.
This article sets out the startup metrics investors examine at each funding stage, with benchmarks in one view. Each section explains the investor lens, so finance leaders can build a data room that answers hard questions early.
How Venture Capital Metrics Shift Across the Funding Journey
Every capital infusion carries its own expectations, and the numbers that win one round rarely suffice for the next. Investors move from validation toward efficiency, then toward profitability and liquidity. The flow below traces that progression from the first round to the last.
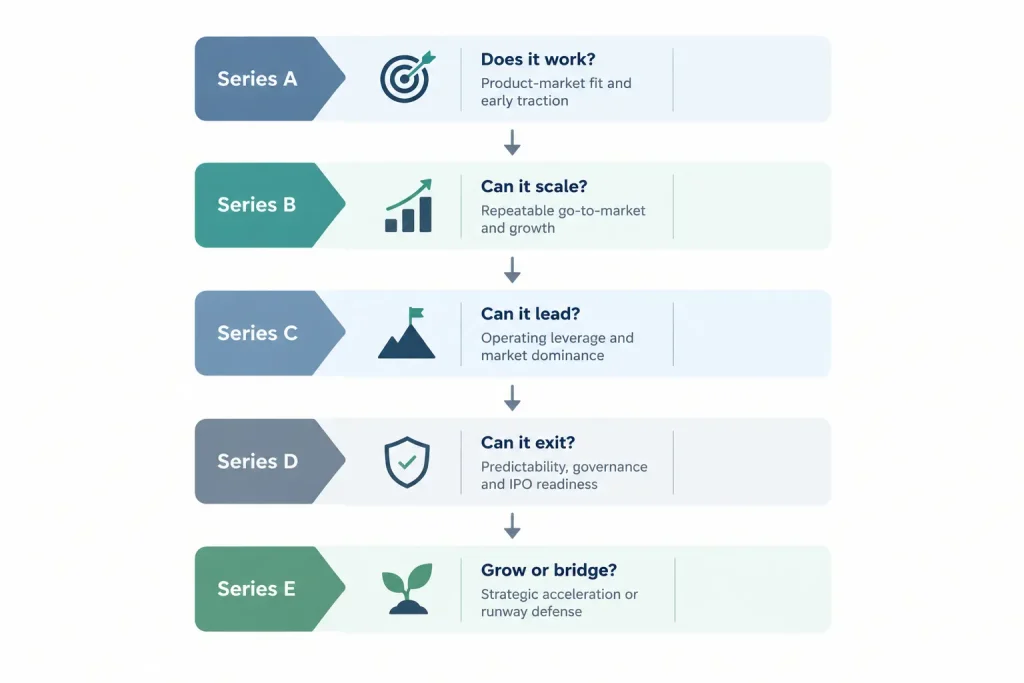
Each stage poses a harder question than the last, and numbers must answer it. Investors weigh the current question most, yet they also check whether the company already builds what the next round will test.
Venture Capital Metrics Benchmarks at a Glance
| Metric | Series A | Series B | Series C | Series D | Series E (Growth Path) |
| ARR | $1M+ | $3M to $10M | $10M+ | $50M+ | $100M+ |
| Growth rate | 15%+ month over month | 100%+ year over year | 70% to 100% year over year | 50% to 80% year over year | 40% to 60% year over year, with efficiency |
| Net revenue retention | 90%+ for early B2B SaaS | 100%+ | 115%+ | 120%+ | 125%+ net dollar retention |
| Burn and profitability | Burn multiple under 2x | Burn multiple under 1.5x | Burn multiple under 1.0x | Minimal burn; EBITDA trending positive | EBITDA near or at break-even |
| Customer economics | LTV at least 3x CAC | LTV/CAC above 4x; CAC payback under 18 months (enterprise) or 12 months (SMB) | CAC payback under 12 months | CAC efficiency by segment | Efficient growth over raw volume |
| Margin | Early signal only | Gross margin 65%+ for SaaS, or improving | Contribution margin positive and improving | Gross margin 70%+ and stable | FCF margin positive, or within 12 months |
The burn multiple divides net burn by net new ARR, showing the cash cost of each new dollar of recurring revenue. Across every row, tolerance for inefficiency narrows with each round, while retention expectations climb.
Series A Metrics: Proving Product-Market Fit and Early Traction
Series A remains the make-or-break round for product-market fit. Investors want proof that the company solves a real, monetizable pain point, and that customers stay once they arrive. Beyond the shared benchmarks above, Series A venture capital metrics lean on three signals of early health:
- Customer acquisition cost, benchmarked against industry peers to gauge early efficiency.
- Churn under 5% per month for B2C, or logo churn under 2% for B2B.
- Engagement depth, with a DAU/MAU ratio above 20% for consumer apps.
The LTV-to-CAC relationship deserves more attention than most early founders give it. One venture-backed performance marketing company grew revenue from $9M to $180M in 24 months. Its finance team built CAC, LTV, and contribution margin analytics before the curve steepened, and that discipline gave investors across three rounds a consistent way to judge the return on each dollar of spend.
Series A investors read growth, retention, and burn together. Strong ARR carries little weight if churn erodes it each quarter, and a high burn multiple suggests growth bought at any price.
Series B Venture Capital Metrics: Scaling Revenue and Go-to-Market
At Series B, the question shifts from whether the product works to whether the business can scale. Investors now care about revenue acceleration and a go-to-market (GTM) engine with predictable results. Customer segmentation matters here, because a sales motion that works in one segment can stall in the next.
Sales efficiency becomes the defining lens at this stage. The magic number, or new ARR divided by sales and marketing spend, should sit above 0.75. Sales cycle duration should hold steady or shorten as the team grows. Diligence then circles a familiar set of questions:
- Does CAC payback hold steady as sales and marketing spend increases?
- Which customer segments expand fastest, and what drives that expansion?
- Can new sales hires reach quota on a predictable timeline?
- Does the sales cycle stay stable as deal sizes grow?
Series C: Operating Leverage, the Rule of 40, and Market Dominance
Series C investors look for operational excellence and signs of category leadership. The central question becomes whether this company will own its market or simply compete in it. Efficiency and a visible path to profitability now carry as much weight as raw growth.
The Rule of 40 and Other Series C Venture Capital Metrics
The Rule of 40 holds that growth rate plus EBITDA margin should equal or exceed 40%. It forces a useful trade-off conversation between expansion and profit. A company growing 60% with a negative 20% EBITDA margin passes, while one growing 25% at break-even falls short.
Two further venture capital metrics complete the Series C picture. Cash runway of 18 to 24 months lets the board execute without a forced raise, and a rising international revenue share, where relevant, shows diversified growth.
Predictability is the quiet currency of a Series C round. Consider a cybersecurity and identity access management company with roughly $30M in ARR. Its driver-based forecasting engine held actuals within plus or minus 5% of forecast for 8 consecutive quarters. The same business lifted gross margin by 12% through pricing discipline and workforce mix, the operating leverage Series C investors hope to find.
Series D Venture Capital Metrics: Pre-IPO and Exit Readiness
By Series D, venture investors begin benchmarking the company against public comparables. Predictability, governance, and a clear exit strategy dominate the evaluation. The financial profile must look stable enough for public markets or a strategic acquirer, with free cash flow improving.
Operational depth matters as much as headline growth, and investors expect consistent reporting on:
- CAC efficiency by customer segment, not only in aggregate.
- Sales velocity and bookings per sales representative.
- Gross churn, tracked separately from net retention.
- IPO readiness markers, including GAAP compliance, clean audits, and mature board governance.
IPO readiness work exposes gaps that private-company reporting can hide for years. At a European-listed public gaming and digital entertainment company, the S-1 readiness process with underwriters and Big Four auditors demanded one definition of revenue across every subsidiary. Dual reporting under IFRS and US GAAP across five countries left no room for inconsistency. Series D investors hold venture capital metrics to that standard long before any listing.
Series E: Strategic Growth Capital or a Defensive Bridge
Series E signals either late-stage maturity or a correction. The venture capital metrics in focus depend on which path the company follows. Investors at this stage watch valuation discipline, liquidation preferences, and downside protection with heightened care.
The Strategic Growth Path
Growth-path companies raise to accelerate ahead of an exit, and the Series E column in the benchmark table describes their profile. Investors expect ARR above $100M, efficient growth, and free cash flow that is positive or close to it.
The Defensive or Bridge Capital Path
Bridge-path companies raise to extend runway, and investors judge them on different venture capital metrics:
- A burn rate in sharp and visible decline.
- A runway extension plan reaching 24 months or more with the new capital.
- Tight cost control, protected gross margin, and consolidated GTM spend.
- A clear M&A or IPO path within 18 to 24 months.
A bridge round succeeds when the burn story is credible. At an early-stage email marketing technology company, an operational turnaround cut monthly burn from $800K to $200K and turned a survival conversation into a stability conversation. Bridge investors fund a plan, and they expect the cost curve to bend before new money arrives.
Building a Venture Capital Metrics Narrative That Earns Trust
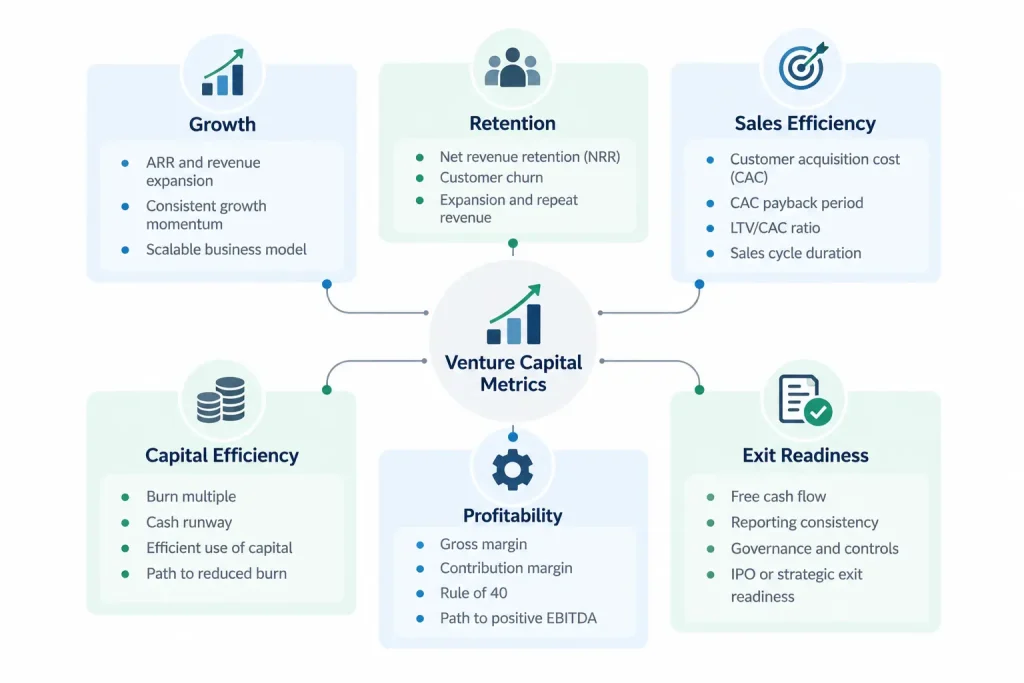
Each funding stage demands a different narrative, but every narrative rests on numbers. Early rounds reward vision and product clarity, while later rounds demand scale, efficiency, and fiscal discipline. Finance teams that understand this evolution raise capital with credibility, helped by a few habits:
- Track next-stage venture capital metrics at least two quarters before the raise begins.
- Reconcile every metric in the pitch deck to the general ledger and the data room.
- Present cohort data alongside headline growth, so retention tells its own story.
- Define each KPI once, in writing, and use that definition in every report.
Three Key Takeaways
- Venture capital metrics evolve with each round, from product-market fit at Series A to exit readiness by Series D and Series E. Founders should prepare for the next stage’s questions, not only the current ones.
- Burn multiple, CAC payback, NRR, and the Rule of 40 gain weight as the company grows. Investors read these VC metrics together, and one strong figure rarely offsets a weak trend elsewhere.
- Credible numbers depend on consistent definitions, clean reconciliation, and a forecast that holds quarter after quarter. Companies that build this discipline early raise capital on better terms and face fewer diligence surprises.
Disclaimer: This article is intended for informational purposes only and does not constitute legal, tax, or accounting advice. You should consult your own tax advisor or counsel for advice tailored to your specific situation.
Hindol Datta is a four-time CFO and senior finance executive with over 25 years of leadership experience across cybersecurity, SaaS, gaming, logistics, digital marketing, medical devices, consumer products, and nonprofit organizations. He has led more than $120M in fundraising and over $150M in M&A transactions while building the financial and operational systems that let complex businesses scale with confidence. He is the author of seven books in the Systems CFO Series and holds active CPA, CMA, and CIA credentials.
AI-assisted insights, supplemented by 25 years of finance leadership experience.