Executive Summary
SaaS revenue forecasting looks simple on the surface: subscriptions, renewals, and a churn rate. Beneath that simplicity sits a system driven by customer behavior, where engagement, renewal, and perceived value determine revenue over time. Every ARR projection is a hypothesis about retention, expansion, time to value, and satisfaction.
The sections ahead explain how CFOs can build forecasts that reflect this reality. They cover why SaaS forecasts are volatile, how cohort logic and scenario thinking strengthen models, and which behavioral signals predict revenue shifts. They also address how to present forecasts to boards with credibility. Together they show SaaS forecasting as a discipline of readiness, not false precision.
Why SaaS Revenue Forecasting Is Harder Than It Looks
Recurring revenue offers the appearance of stability, with even monthly fees and deferred recognition. Many forecasts build on tidy metrics such as ARR, CAC, and net dollar retention. Yet SaaS companies sell an ongoing relationship, and relationships rarely follow linear math.
Booked Today, Earned Tomorrow
A SaaS company books revenue today but earns it over time. Every dollar of ARR acts like a contractual option that customers may or may not renew. The CFO must forecast revenue that is contractual on paper but fragile in practice.
Aggregate reporting adds to the challenge for finance teams. Monthly recurring revenue and blended churn hide differences between cohorts acquired under different conditions. A cohort won during heavy discounting behaves differently from one acquired at full price. A poorly onboarded cohort may carry hidden churn risk even when current usage looks stable.
Signals also arrive late in most SaaS businesses. Usage often declines months before revenue does, as customers underuse licenses or defer expansion without canceling. Financial results trail behavior, so the visible signal carries little predictive value on its own.
The Problem with Composite Metrics
Net dollar retention combines several distinct movements into one figure. Expansion may come from a single large customer while churn rises quietly elsewhere. Forecasting on NRR alone treats separate drivers as if one cause governed them all.
Decomposing Net Dollar Retention for SaaS Forecasting
| Component | Main Drivers | Leading Indicators to Watch |
| Expansion | Perceived future value, internal champions, seat growth | Feature adoption depth, usage near license limits |
| Cross-sell | Product breadth, integration fit, account coverage | Engagement with adjacent modules, trial activity |
| Contraction | Budget pressure, partial adoption, shifting priorities | Declining active users, unused licenses |
| Churn | Onboarding gaps, unresolved issues, sponsor turnover | Falling login frequency, rising support tickets |
Calendar-based forecasting adds false precision on top of composite metrics. Customers renew, adopt, and churn on their own timelines, yet finance reports in quarters. Fixed periods suggest that risk and growth respect fiscal boundaries when they do not.
Building Cohort-Based, Probabilistic SaaS Forecasts
The first step toward a better forecast is giving up the illusion of certainty. A forecast should earn belief without inviting over-belief. In SaaS, risk often builds through slow erosion instead of sudden shocks.
Shift from Calendar Logic to Cohort Logic
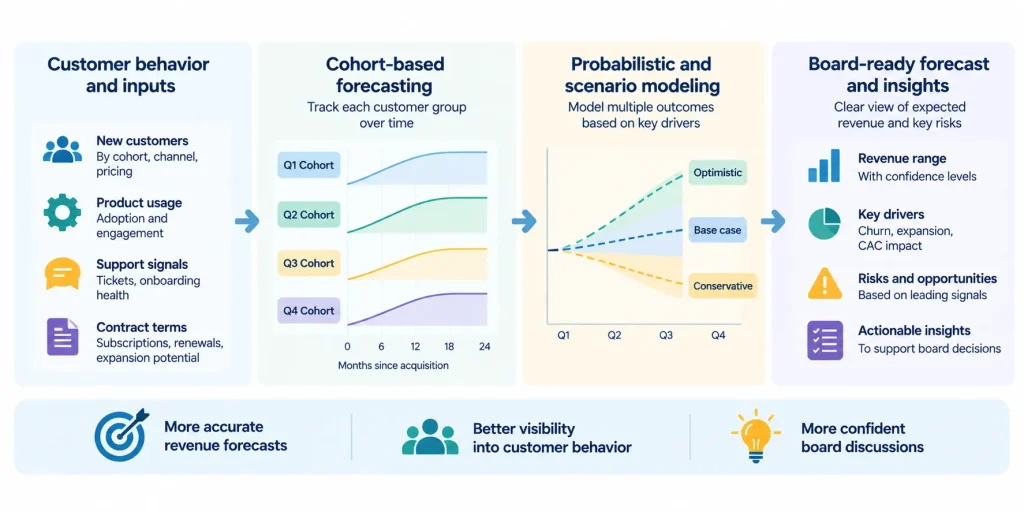
Traditional forecasts treat revenue as a stream fed by acquisition and reduced by aggregate churn. Cohort forecasting instead tracks each group of customers by acquisition period, channel, and pricing. Each cohort follows its own path of expansion, stagnation, or decline.
Cohort models show how each vintage ages and where lifetime value curves bend. They also reveal how onboarding, support, and product changes alter revenue trajectories. That view replaces the fiction of smooth continuity with differentiated behavior.
A marketplace SaaS company with operations in the United States and Poland shows the value of this approach. Cohort and unit economics models anchored investor diligence during a $20M Series B. Investors could see how different customer groups contributed to growth over time.
Apply Bayesian Thinking and Scenario Logic
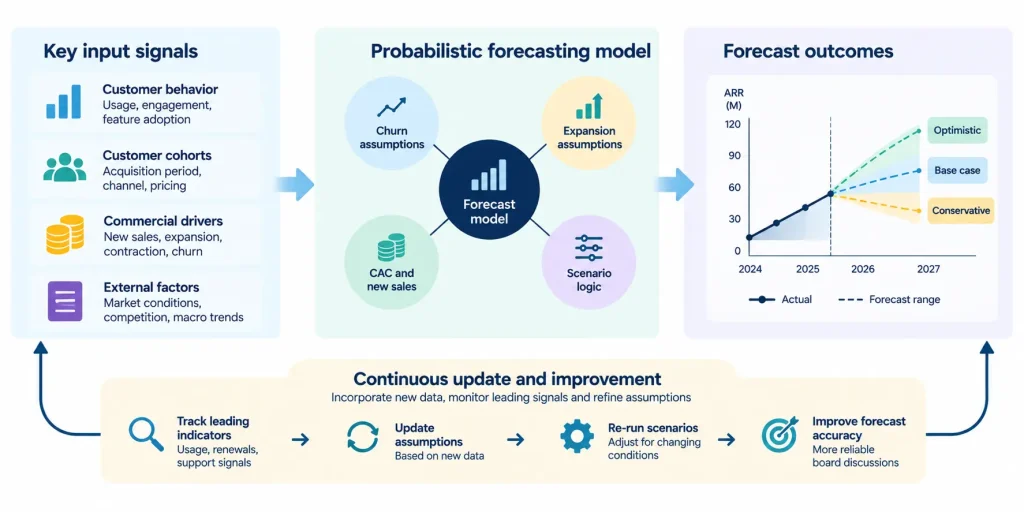
Every SaaS forecast is a hypothesis that new data should update. When churn data, a product launch, or a macro shock arrives, the model should revise its underlying beliefs, not just its outputs. In this frame, churn signals whether the value proposition still holds, while CAC reflects market friction.
Scenarios should differ in cause, not only in magnitude. Useful questions include what happens if product-market fit erodes, if pricing power weakens, or if the highest-value cohorts reach saturation. Each scenario should describe what leaders believe, which signals they will watch, and how events would unfold.
Strong SaaS revenue forecasting models share several structural traits:
- Modular assumptions for churn, expansion, and CAC that teams can adjust without rebuilding the model
- Cohort curves instead of single blended churn or expansion rates
- Confidence ranges instead of single point estimates for revenue
- Causally distinct scenarios tied to observable leading signals
- Clear documentation of what would change the forecast
A cybersecurity and identity SaaS company with about $30M in ARR shows what disciplined modeling can achieve. A driver-based forecasting engine and capacity model kept actuals within plus or minus five percent of forecast for 8 consecutive quarters. Explicit drivers made each assumption traceable and easier to revise.
Behavioral Signals That Drive SaaS Forecasting Accuracy
Forecast probabilities bend because the underlying system is human. Customers renew when they feel confident that value continues, and that confidence depends on experience as much as functionality. Models that ignore behavior miss the earliest signs of revenue change.
Churn and Expansion as Behavioral Outcomes
Churn rarely follows a stable, seasonal percentage in practice. A broken integration, an ignored support ticket, or a departing executive sponsor can reshape a customer’s entire view of the product. Sentiment also travels within tight industries, so one customer’s frustration can influence others.
Expansion reflects a belief that more value lies ahead than behind. Onboarding quality, ease of access, and internal champions shape that belief. Expansion therefore works as an early indicator of confidence, not merely a lagging sign of satisfaction.
Expectations also shift over time in ways that affect renewals. A tool that felt impressive in year one may feel dated in year three, even if it has not changed. The gap between what customers expected and what they now experience drives renewal risk.
Leading Behavioral Signals and Forecast Implications
| Signal | What It May Indicate | Forecast Implication |
| Declining login frequency | Weakening engagement or fading relevance | Raise churn probability for affected accounts |
| Narrowing feature usage | Shrinking perceived value | Lower expansion assumptions for the cohort |
| Rising support dependence | Friction or unresolved product issues | Flag renewal risk ahead of contract dates |
| Usage near license limits | Growing reliance on the product | Increase expansion probability |
| Executive sponsor change | Loss of internal champion | Review renewal likelihood and engagement plan |
Turning Behavior into Forecast Inputs
The CFO should work with product and customer success leaders to identify proxy signals of account health. If a cohort’s usage declines in month four, the revenue impact may not appear until renewal in month eleven. The model must read that signal early, not after the fact.
Internal friction between teams can distort forecasts as well. Sales may project renewal likelihoods that conflict with usage data, and product changes can alter the value equation for key customers. Macro conditions add another layer, because customers cut tools out of caution during downturns.
An email marketing SaaS company offers a relevant reference for acting on early financial signals. Finance reduced monthly cash burn from $800K to $200K. Decisions of that scale depend on reading forward indicators instead of waiting for lagging results.
Communicating SaaS Revenue Forecasting to the Board
A clean, well-visualized forecast can still fail to persuade. Directors need to understand the reasoning behind the numbers, not just the outputs. A forecast is an argument about the future, not a proof.
Credibility, Narrative, and Forecast Error
Credibility in SaaS comes from showing how finance thinks, not only from hitting a number. Forward-pulled deals and optimistic pipeline math can inflate results temporarily. A strong CFO explains why churn improved, how the team modeled expansion, and where cohort behavior shifted.
A clear narrative gives each assumption operational weight. The board should hear what changed since last quarter, which experiments produced signal, and which feedback loops strengthened or broke. The CFO must balance humility about uncertainty with conviction about the plan.
Forecast error should function as a governance tool. Some variances reveal flawed assumptions, while others reflect outside shocks. Board packets should elevate assumptions and present scenarios as navigable futures, with charts that highlight inflection points and sensitivities.
The CFO should also resist the temptation to project false precision. Rounding numbers until they sound definitive or suppressing volatility to calm directors erodes trust over time. Openly stating the risks in a forecast reflects strategic integrity.
A venture-backed digital marketing company that grew from $9M to $180M in revenue shows the value of clear unit economics in board discussions. Finance built CAC, LTV, and contribution margin frameworks to guide growth decisions. Those measures gave directors a transparent basis for evaluating forecasts. SaaS revenue forecasting, practiced this way, helps the company reason toward a future it cannot fully see.
Three Key Takeaways
- SaaS revenue forecasting must account for behavioral volatility, because aggregate metrics and calendar periods hide cohort differences and lagging signals.
- Strong SaaS forecasting models use cohort curves, Bayesian updates, modular assumptions, and causally distinct scenarios tied to observable signals.
- Boards trust forecasts that make reasoning visible, treat variance as learning, and openly state risks instead of projecting false precision.
Disclaimer: This article is intended for informational purposes only and does not constitute legal, tax, or accounting advice. You should consult your own tax advisor or counsel for advice tailored to your specific situation.
Hindol Datta is a four-time CFO and senior finance executive with over 25 years of leadership experience across cybersecurity, SaaS, gaming, logistics, digital marketing, medical devices, consumer products, and nonprofit organizations. He has led more than $120M in fundraising and over $150M in M&A transactions while building the financial and operational systems that let complex businesses scale with confidence. He is the author of seven books in the Systems CFO Series and holds active CPA, CMA, and CIA credentials.
AI-assisted insights, supplemented by 25 years of finance leadership experience.