
Executive Summary
Anyone asking what are the two types of financial benchmarking will find a tidy answer: internal benchmarking compares a company against its own history, and external benchmarking compares it against peers. The harder question is how either one produces strategic value instead of a ranked spreadsheet. Done well, financial benchmarking is a form of self-inquiry that begins with knowing which comparisons are valid.
This article covers peer selection, metric framing, and data normalization, then shows how benchmarking works as a diagnostic mirror. It closes with the design of a recurring benchmarking system and the use of comparison to explain strategic divergence.
What Are the Two Types of Financial Benchmarking?
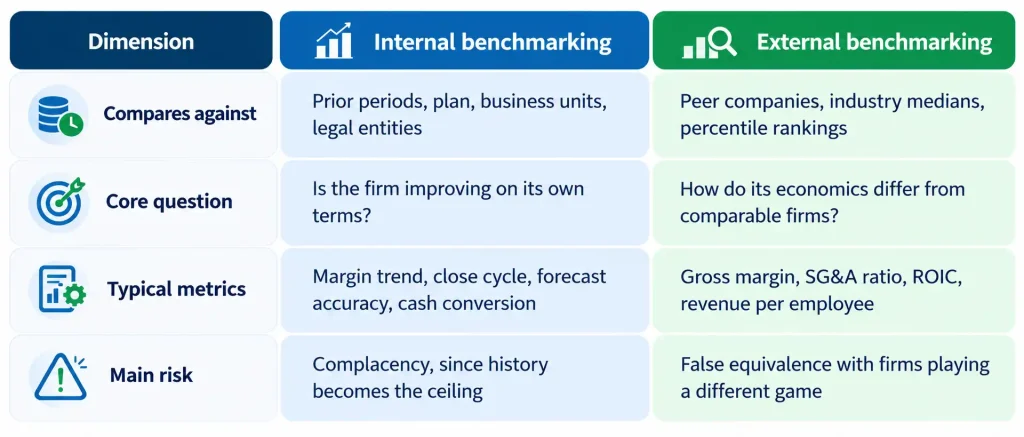
Every financial benchmarking program rests on two lenses, internal and external. Each answers a different question, and neither is complete alone.
Internal vs. External Benchmarking at a Glance
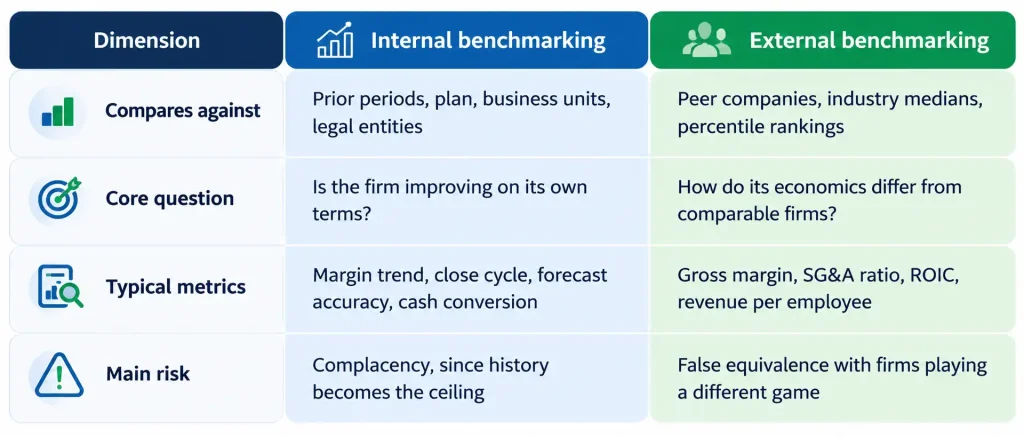
Internal benchmarking reads the business as a sequence instead of a snapshot, while external benchmarking places that sequence beside the paths of peers. Both lenses work best when the CFO treats them as interpretation, not imitation.
Choosing Peers: The Foundation of External Financial Benchmarking
Every comparison admits that self-understanding is still incomplete, yet too many finance teams rush to assemble ratios and sector averages before asking whether the comparison holds at all. Matching the herd can slowly become a comfortable excuse for mediocrity.
Building a Theory of the Firm Before Selecting Peers
Before choosing peers, the CFO needs a clear account of the business model, time horizon, capital structure, and strategic ambition. A SaaS company comparing its cost structure to a global ERP incumbent will produce clean spreadsheets and incoherent conclusions.
That theory belongs in financial grammar: revenue composition, marginal cost curves, capital formation cycles, and embedded optionality. The CFO can then choose peers by strategic congruence instead of NAICS codes. The peer logic must also stay dynamic, because a firm in transition through acquisition or reinvention will outgrow yesterday’s comparisons.
Selecting Metrics That Carry Interpretive Weight
A useful benchmarking framework separates three families of financial ratios:
- Operational health, such as gross margin and cost structure
- Capital efficiency, such as free cash flow, ROIC, and working capital turns
- Strategic positioning, such as R&D intensity, growth rate, and pricing power
Gross margin may reveal cost structure while obscuring pricing power, and SG&A as a percentage of revenue may signal discipline or underinvestment. Free cash flow can conceal a starvation of future value creation.
Normalizing Data Across Reporting Conventions
One firm books certain costs as R&D while another places them in cost of goods sold. Deferred revenue, stock-based compensation, and restructuring charges all distort comparability until the analyst reconciles them. A quality-of-earnings review on an acquisition target often shows how far reported EBITDA can drift from economic reality before anyone makes these adjustments.
Internal Benchmarking and the Problem of Time
A single fiscal year can make a firm look inefficient during deliberate investment, or misleadingly lean during deferred renewal. Internal benchmarking corrects this by reading metrics as a narrative in sequence. A forecast that holds within five percent of actuals for 8 consecutive quarters says more about a forecasting engine than any single quarter’s ratio. That trend line is what gives a board confidence in the numbers.
Resisting the Pull Toward Conformity
Benchmarking carries a final temptation: the desire to conform. If margins sit below the median, should the firm cut costs? If revenue per head runs higher, should leadership celebrate? Strategy is not lived in medians, and durable advantage often rests on conscious divergence. A firm that knows why it accepts a longer payback period is acting with self-awareness, not irrationality.
Financial Benchmarking as a Strategic Mirror
The value of benchmarking lies less in what it reveals about others than in what it shows about the firm itself. Placed beside peer data, internal numbers become an x-ray of design, showing where cost curves bend and where margins rest on structural asymmetry.
Treating Deviation as Signal
The central fallacy in benchmarking holds that every deviation is a deficit. Deviation may instead reflect deliberate design:
- Higher customer acquisition cost may pair with longer retention and stronger cohort profitability.
- Higher CapEx intensity may build proprietary infrastructure that peers cannot replicate.
- Lower gross margin may fund faster product iteration, which compounds into lower churn.
How a Lower Gross Margin Can Compound into Advantage
| Step | Mechanism | Financial effect |
| 1 | Accept a lower gross margin | Funds faster product iteration |
| 2 | Iterate faster | Raises user satisfaction |
| 3 | Lift satisfaction | Reduces churn |
| 4 | Retain more customers | Increases upsell velocity |
| 5 | Expand faster | Offsets the initial margin erosion |
None of this chain appears on a dashboard. The CFO has to infer it through second-order reasoning and narrative recognition.
When the Mirror Reveals Real Weakness
Some benchmark gaps point to genuine problems instead of strategy. Weak cash conversion may reflect the business model or lax collections. Lagging inventory turns may stem from vertical integration or from poor planning visibility. When demand planning and SKU rationalization lift inventory turns from 3x to 7x, the released working capital proves the gap was never strategy. It was an unresolved problem dressed as one.
Naming these misalignments turns benchmarking into a tool of self-governance. As strategy shifts, the peer group must shift with it, since a hardware vendor that moves into data economics may come to resemble a subscription analytics platform.
Designing a Financial Benchmarking System That Lasts
An insight is only as valuable as the system that sustains it. Where quarterly decks often end up as forgotten slide relics, a durable system is dynamic, contextual, and built to reduce noise instead of adding more ratios.
Core Components of a Benchmarking Intelligence Engine
| Component | Design principle |
| Peer set | Rotating, chosen by product model, revenue velocity, go-to-market complexity, capital cycle, and margin structure |
| Metrics | Foundational indicators that persist, plus strategic indicators tied to current initiatives |
| Cadence | Quarterly, anchored to the strategic planning rhythm |
| Narrative layer | Commentary that frames each variance as a consequence |
| Tooling | Linked to forecasts, OKRs, and risk assessments |
| Governance | Room to retire metrics and peers that no longer fit |
Strategic indicators should shift as the firm’s agenda changes. A firm expanding internationally may add foreign exchange sensitivity, while one investing in AI may track R&D intensity against digital peers.
Asking What Changed, and Why
Each cycle should ask which metrics moved and which forces drove the shift. Did the gross margin gap narrow through internal discipline, or did a peer cut R&D in ways worth avoiding? A siloed benchmarking report cannot shape behavior, so it belongs beside budgeting and quarterly business reviews. Governance should also leave room for dissent, since a peer may merge or a metric may stop mattering after a pivot. That tolerance separates a benchmarking system, which builds intelligence, from a benchmarking script, which enforces imitation.
Using Financial Benchmarking to Justify Strategic Divergence
Numbers on their own rarely persuade boards or investors, who want to know why performance makes sense given who the company is. Benchmarking supplies the vocabulary to show that a firm’s difference is by design.
Two Illustrations of Benchmarking as Narrative
A high-growth software firm runs SG&A ten points above its sector median. Overlaid with cohort revenue and a CAC to LTV curve, the excess reads as a deliberate land-and-expand strategy. A logistics business shows return on assets below its peer set. A deeper look at asset durability and location density reveals optionality in regional nodes, ready to add capacity cheaply when demand recovers.
Comparison can also anchor expectations before a major shift, such as entering adjacent markets or divesting legacy units. In a growth-stage fundraise, cohort and unit economics benchmarks give investors a frame for judging growth that might otherwise look expensive.
Calibrating the Message for Each Audience
Overuse of benchmarking breeds skepticism, so restraint is part of the craft. Some strategic choices will leave a firm incomparable for a time, and coherent strategic logic must then carry the argument.
Three Key Takeaways
- Financial benchmarking has two types, internal and external, and each needs the other. Internal benchmarking tracks progress against the firm’s own intent, while external benchmarking tests its economics beside true peers.
- Peer selection and metric framing decide whether a benchmark clarifies or distorts. Choose peers by strategic congruence, normalize the data, and read deviation as a possible signal before treating it as a deficit.
- Benchmarking creates value only when it becomes a recurring system with a narrative layer. Used that way, it lets a CFO present divergence to boards as deliberate design instead of drift.
Disclaimer: This article is intended for informational purposes only and does not constitute legal, tax, or accounting advice. You should consult your own tax advisor or counsel for advice tailored to your specific situation.
Hindol Datta is a four-time CFO and senior finance executive with over 25 years of leadership experience across cybersecurity, SaaS, gaming, logistics, digital marketing, medical devices, consumer products, and nonprofit organizations. He has led more than $120M in fundraising and over $150M in M&A transactions while building the financial and operational systems that let complex businesses scale with confidence. He is the author of seven books in the Systems CFO Series and holds active CPA, CMA, and CIA credentials.
AI-assisted insights, supplemented by 25 years of finance leadership experience.