
Executive Summary
Product profitability analysis changes character once the question shifts from whether a product made money to whether it should exist, turning arithmetic into judgment. A product may look profitable while depending on cross-subsidies or brand halo, while another may lose money yet anchor an entire ecosystem.
The sections ahead explain how CFOs can approach profitability analysis as a strategic lens. They cover why cost attribution often misleads, why contribution margin offers a better compass, and how constraints reshape product value. They also address how to read profit as a signal instead of a verdict. Together they show profitability as a set of better questions, not a single number.
Why Product Profitability Analysis Often Misleads
Many teams present product-level results with the confidence of settled fact. In reality, these models rest on assumptions about how to divide shared costs and credit shared revenue, and each assumption reshapes the answer.
The Limits of Cost Allocation
Every profitability model must allocate shared costs such as overhead, marketing, R&D, and executive time. Common methods split these costs by revenue, headcount, units shipped, or floor space. Each method is defensible, yet each can mislead.
Consider a product that generates 10% of revenue and receives 10% of marketing overhead. Its success may depend on brand halo from a flagship product, which the allocation ignores.
The traditional P&L also assumes that products separate cleanly. In practice, products share channels, customer relationships, and pricing power. Removing one product may unravel the economics of others that depended on it.
Nonlinear Costs and Internal Incentives
Costs rarely behave as neatly as models assume. Fixed costs can act as variable over time, and step costs such as server capacity create sudden jumps. Support costs often track product complexity or customer type more closely than volume.
Incentives add further distortion once profitability drives budgets and headcount. Product teams may push for narrower cost definitions, while corporate may centralize overhead to protect favored bets. The resulting models pass audit yet fail intuition.
A $170M medical device manufacturer with operations in Copenhagen, Cork, and Taiwan illustrates why cost discipline matters. Work as operations controller there involved standard costing and bill-of-materials management across multiple sites. Consistent cost structures across locations made product-level economics comparable.
A Layered View of Profitability
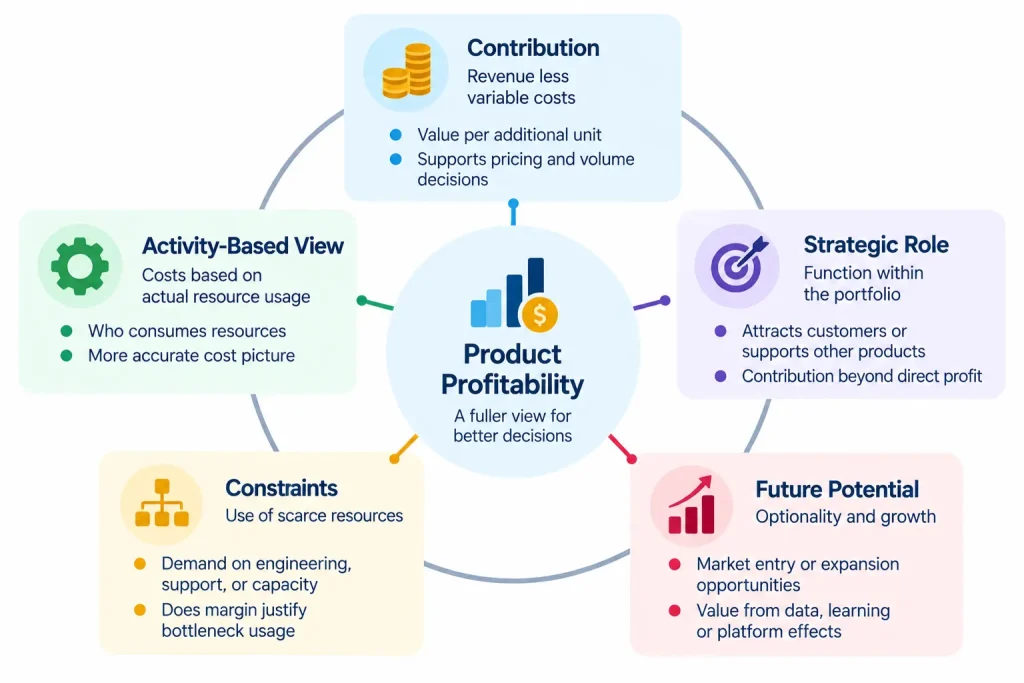
A more honest approach treats profitability as several lenses viewed together instead of one figure. Each lens answers a different strategic question about the product.
Five Lenses for Product Profitability Analysis
| Lens | What It Measures | Key Question |
| Direct contribution | Revenue less directly attributable variable costs | Does each additional unit create value |
| Activity-based view | Costs assigned by actual resource usage | Who consumes which resources, and how intensely |
| Systemic role | Strategic function within the portfolio | Does the product attract customers or support others |
| Constraint lens | Use of scarce resources such as engineering or support | Does its margin justify the bottleneck it consumes |
| Optionality value | Future potential such as market entry or data capture | What future value does the product make possible |
No single lens gives the full picture on its own. The strategic CFO triangulates among them to form a pattern instead of a verdict.
Contribution Margin as a Strategic Compass
Contribution margin offers a cleaner starting point for profitability analysis. It measures revenue less variable costs and avoids allocating costs that teams cannot trace. That focus aligns with how real decisions get made.
What Contribution Reveals
Full absorption costing mixes controllable decisions with arbitrary allocations. Contribution isolates the marginal benefit of each product, free of overhead noise. When deciding whether to keep, expand, or retire a product, the key question is whether the next unit sold creates positive economics.
Contribution also aligns with how accountability works in practice. A product manager cannot control how finance allocates shared service costs. That manager can influence pricing, discounting, bundling, and usage patterns, all of which shape contribution.
For capital allocation, contribution works as a triage tool. A $1M contribution stream from a simple, self-serve product may be worth more than a $5M stream from a support-intensive offering.
Making Contribution Usable
Contribution analysis works best as a decision-support system instead of a static report, guided by three principles:
- Simplicity, so teams can explain a product’s unit economics on a whiteboard in minutes
- Speed, so directional insight arrives in time to guide decisions
- Transparency, so teams know what counts, what does not, and why
Contribution has limits that leaders must keep in view. It omits fixed costs and ignores strategic spillovers, brand equity, and learning effects. In platform businesses, value may flow indirectly, so teams should track contribution by customer cohort and strategic pillar as well as by product.
A professional services firm with five business units shows the value of contribution-focused analytics. Finance built engagement-level profitability and utilization analytics from scratch. Those measures revealed where the business created margin and where it leaked.
Constraint-Based Product Profitability Analysis
Every enterprise operates under constraints such as time, capital, attention, and capacity. One constraint usually binds more tightly than the rest and sets the pace of value creation. Not every profitable product is strategic, and not every strategic product looks profitable in the P&L.
Measuring Return on the Bottleneck
Eliyahu Goldratt’s theory of constraints holds that a system’s most limiting factor determines its performance. Applied to products, the key measure becomes contribution per unit of constraint. A product that uses little of the bottleneck adds throughput without adding load.
Naming the constraint is the first step, and many companies get it wrong. In a startup, the bottleneck may be engineering bandwidth. In enterprise software, it may be sales attention, while in a direct-to-consumer brand it may be customer trust. Mapping each product’s use of that constraint often reorders the portfolio.
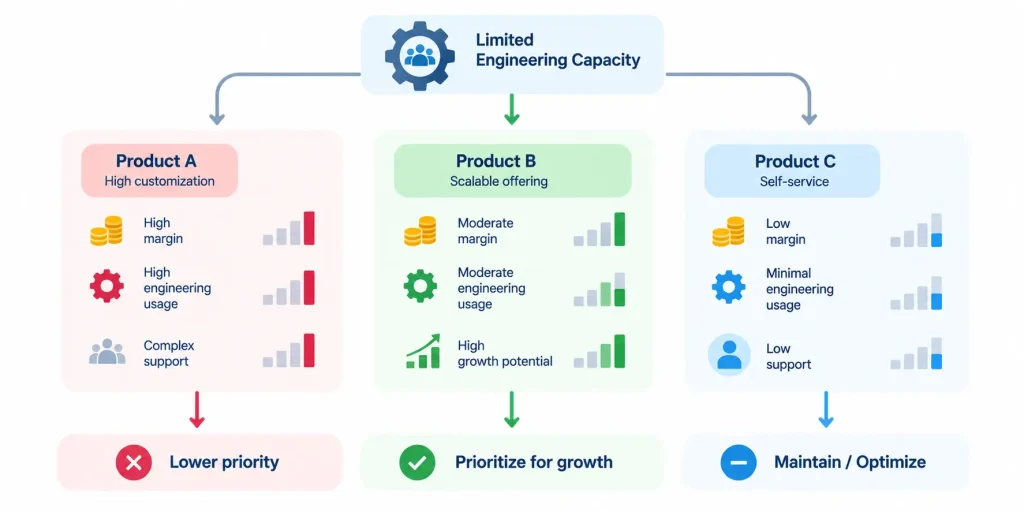
Consider a software company with three products that compete for the same engineering team. Each product draws on that shared capacity in a different way.
Constraint-Based View of a Three-Product Portfolio
| Product | Margin Profile | Engineering Use | Constraint-Based Assessment |
| Product A | High margin, heavy customization | About 40% of engineering time | Bottleneck sink unless pricing justifies its load |
| Product B | Moderate margin, scalable | About 20% of engineering time, drives 60% of new trials | Throughput driver worth expanding |
| Product C | Low margin, self-serve | Under 5% of engineering time | Low-load yield that absorbs excess demand |
Traditional margin analysis favors Product A, and contribution analysis may lean toward Product B. A constraint lens exposes A as a drain on the bottleneck, B as the growth engine, and C as nearly free margin.
Constraint-Aware Decisions
Constraint visibility reshapes several common decisions about the portfolio. Products with modest margins but minimal constraint use become more attractive to keep. High-constraint products should carry premium pricing, and new investment should relax the bottleneck or raise throughput per unit of constraint.
Optimizing constraints too tightly carries its own risk. A company that squeezes engineering capacity may starve exploration, and one that over-optimizes sales bandwidth may weaken customer relationships. Some constraints deserve protection instead of maximum efficiency.
A $127M global consumer products company shows how portfolio discipline can transform results. Demand planning, SKU rationalization, and logistics optimization more than doubled inventory turns from 3x to 7x. Pruning and prioritizing products freed capital and capacity for stronger lines.
Reading Profit as a Signal
Many leaders treat reported profit as a final truth. In practice, it is a lagging signal shaped by pricing, allocation choices, and timing. It shows what happened under a set of assumptions, not what must happen next.
Separating Signal from Noise
Backward-looking profit metrics tend to penalize investment in future options. Promising strategies often start unprofitable, while mature products may show high margins just before saturation. Reading these signals well requires attention to marginal economics, constraint-adjusted throughput, cohort-level unit economics, and time to break-even.
Noise comes from misaligned allocations, sunk cost thinking, and over-aggregated roll-ups. A product may look highly profitable until analysis shows that its revenue depends on bundling with a lower-margin, higher-churn companion. The signal needs context before anyone acts on it.
Bayesian reasoning helps leaders interpret these signals over time. Each quarter’s results should update beliefs in proportion to their reliability, not overturn strategy on a single data point. CFOs can support this discipline by stating confidence ranges, running sensitivity analyses, and versioning key assumptions.
Profit also serves as an external language for investors and partners. Some of the most important strategic moves reduce near-term profit, such as launching a platform product or entering a new segment. The CFO must explain when losses represent investment and when they do not.
A cybersecurity and identity SaaS company with about $30M in ARR shows how profitability analysis can drive improvement. Finance contributed to a 12% increase in gross margin while building driver-based forecasting and capacity models. Clear visibility into cost drivers helped leaders act on the right signals. Product profitability analysis, practiced this way, becomes a diagnostic for system health instead of a post-mortem.
Three Key Takeaways
- Product profitability analysis should combine contribution, activity-based costing, strategic role, constraint usage, and optionality instead of relying on a single allocated figure.
- Contribution margin per unit of constraint often reveals which products deserve investment, which need repricing, and which quietly drain scarce capacity.
- Profit is a lagging signal, so CFOs should interpret it with context, confidence ranges, and clear narratives about investment versus decline.
Disclaimer: This article is intended for informational purposes only and does not constitute legal, tax, or accounting advice. You should consult your own tax advisor or counsel for advice tailored to your specific situation.
Hindol Datta is a four-time CFO and senior finance executive with over 25 years of leadership experience across cybersecurity, SaaS, gaming, logistics, digital marketing, medical devices, consumer products, and nonprofit organizations. He has led more than $120M in fundraising and over $150M in M&A transactions while building the financial and operational systems that let complex businesses scale with confidence. He is the author of seven books in the Systems CFO Series and holds active CPA, CMA, and CIA credentials.
AI-assisted insights, supplemented by 25 years of finance leadership experience.