Executive Summary
Fully diluted ownership is the number investors use, and it is rarely the number founders start with. It counts every share that would exist if all convertible instruments converted to common stock, and it is the only accurate way to read a cap table during a raise.
This article walks through why founders and investors read the same cap table differently, how to calculate fully diluted shares correctly, how investors evaluate risk and return once ownership is defined, and how a CFO can turn that modeling into investor trust rather than negotiation friction.
Why the Cap Table Reads Differently to Founders and Investors
Founders tend to see the cap table as a record of trust and contribution. Investors see it as a risk map, a return model, and a governance blueprint, all in one document. That difference in vantage point explains many of the miscommunications that surface during a funding round.
Reading a cap table the way an investor does means asking a specific set of questions. What percentage of the company is owned on a fully diluted basis? What rights attach to those shares? How deep is the preference stack? What multiple is realistic across a range of exit outcomes? Where are the landmines, such as outdated notes, unexercised options, or inconsistent SAFEs?
A clean cap table signals clarity and competence. A messy one, full of overhangs and unresolved instruments, signals risk. In venture financing, perceived risk drives the price of capital, which means cap table hygiene has a direct line to valuation.
Fully Diluted Ownership: The Investor’s Baseline
Fully diluted ownership counts every share that would exist if all convertible instruments, including SAFEs, convertible notes, options, and warrants, were converted into common stock. Founders sometimes speak in terms of issued or outstanding shares instead, and that mismatch creates confusion at exactly the wrong moment in a term sheet negotiation.
A Worked Example
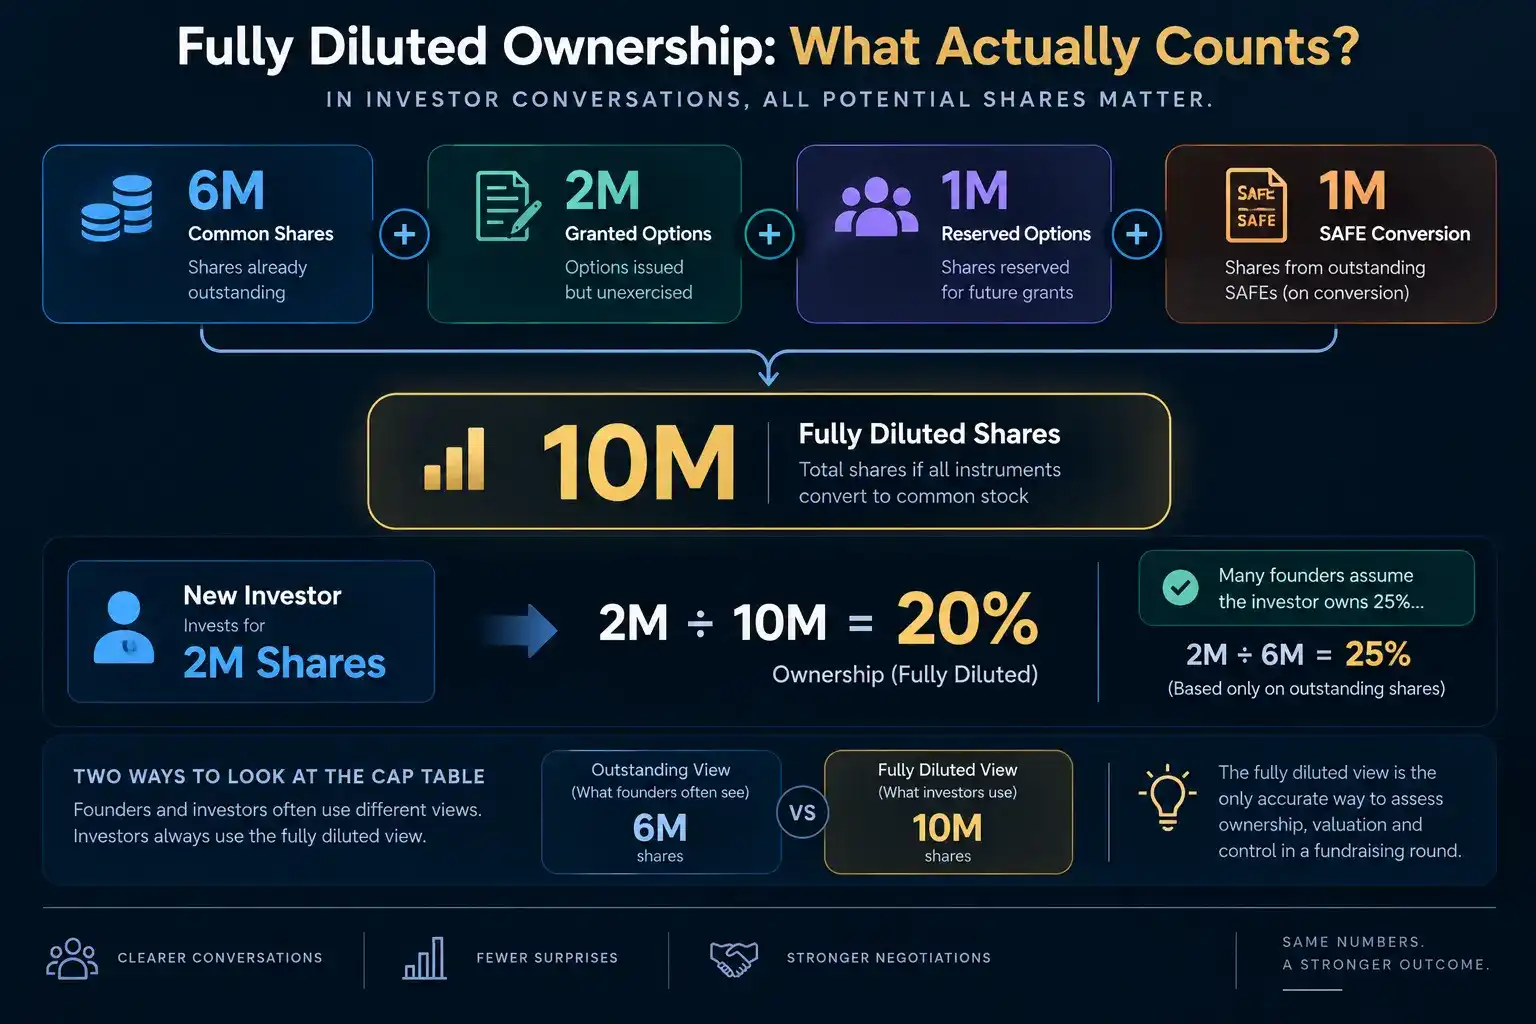
- 6 million shares of common stock outstanding
- 2 million options granted and unexercised
- 1 million shares reserved for future option grants
- 1 million shares convertible from outstanding SAFEs
The fully diluted share count here is not 6 million. It is 10 million. An investor buying 2 million shares in the next round does not own 25 percent. That investor owns 20 percent. This distinction determines valuation, control, and returns, and it is never academic once real dollars are on the table.
A company with a 25 percent option pool pre-money and several outstanding SAFEs will see meaningful founder dilution once a priced round closes. Investors model that dilution as a matter of course. Founders often do not, and the gap tends to surface during negotiation rather than before it.
Many instruments, including preferred shares, convertible notes, and SAFEs, convert into common stock at a triggering event such as a priced round or an exit. The conversion terms shift with valuation caps, discounts, and conversion triggers, so investors model ownership on an as-converted basis rather than a present-day one. A well-prepared CFO provides that modeling proactively, which signals competence and lowers negotiation friction before it starts.
How Investors Evaluate Risk and Return on the Cap Table
Ownership percentage alone does not tell an investor what a stake is worth. A five million dollar investment for 20 percent ownership means something different in every company, depending on five factors.
Liquidation Preferences
If a company has raised 30 million dollars under a 1x participating preferred structure, the first 30 million dollars of any exit goes to investors before common shareholders, including founders and employees, see anything. Sophisticated investors model this outcome carefully before committing capital.
Preference Stack Depth
The more rounds of preferred equity a company has raised, the harder it becomes for new investors to participate meaningfully in an exit unless the company grows substantially. Senior preferences held by earlier rounds can subordinate later investors.
Option Overhang
A large, unallocated option pool creates future dilution. Investors check whether the pool is sufficient or needs a refresh, and an insufficient pool often gets increased pre-money, diluting current holders before the new investment is even calculated.
Cap Table Concentration
Equity concentrated in departed founders or inactive advisors is a red flag. If 15 percent of equity sits with people no longer contributing, that signals misalignment and dilution that is not doing any productive work.
SAFE and Note Overhangs
Outstanding SAFEs and notes with varying caps and discounts can create dilution that is difficult to see without running the numbers. Sophisticated investors run waterfall scenarios to estimate final ownership, and founders who cannot produce that modeling themselves tend to look unprepared.
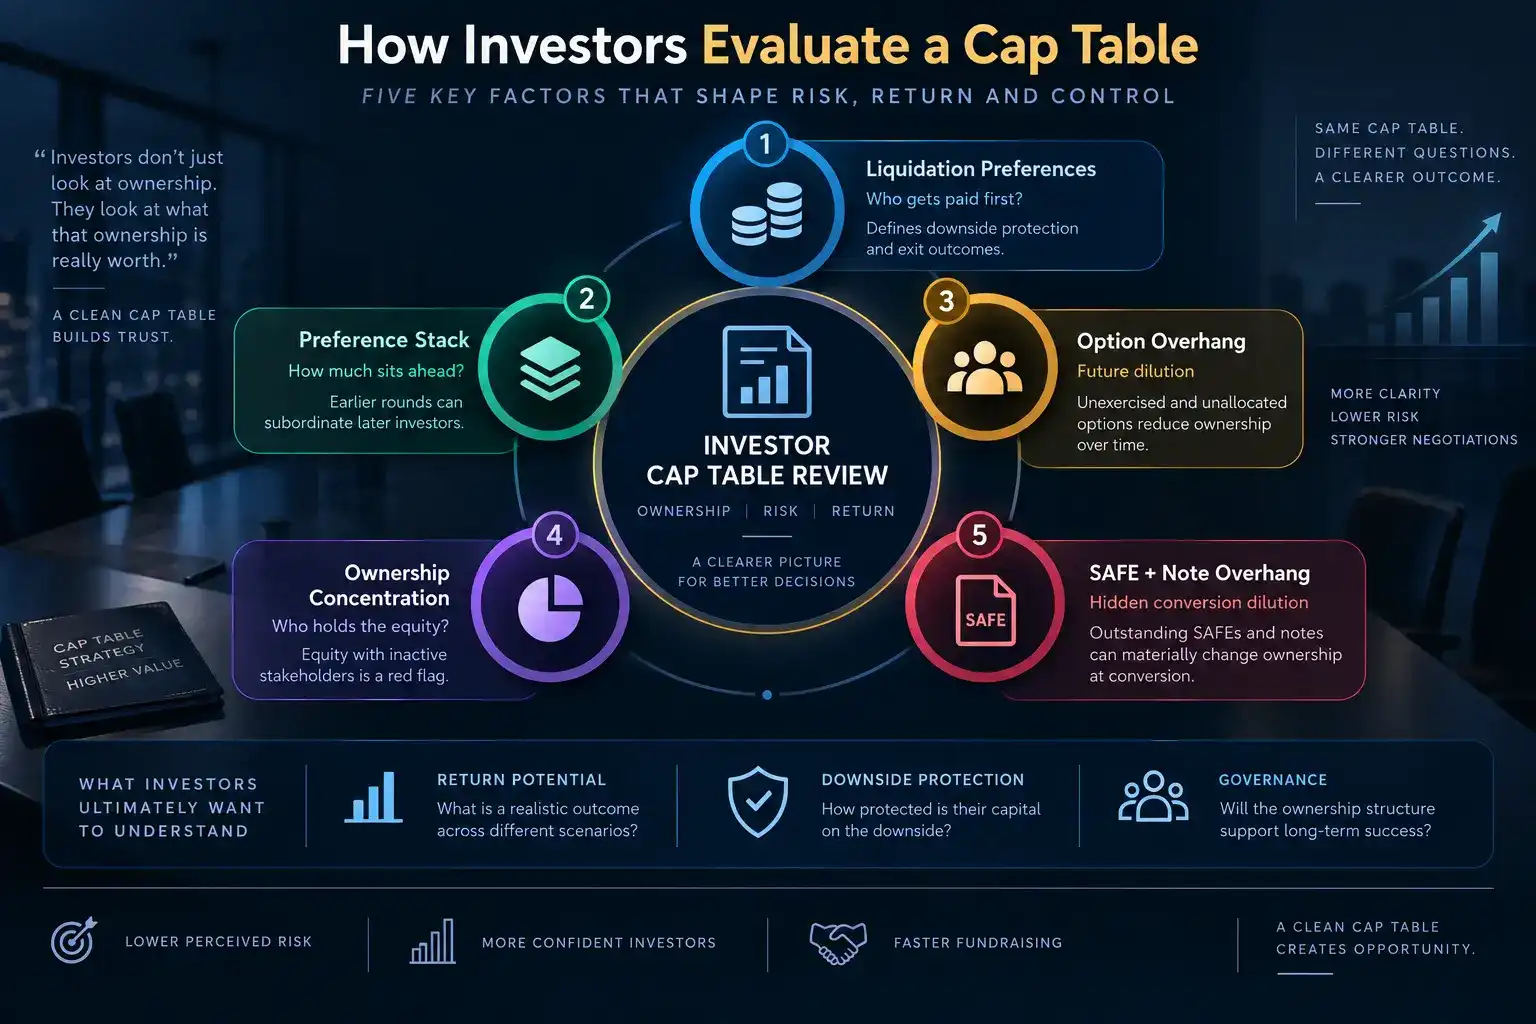
Investors ultimately want to know three things: what return is realistic across different outcomes, how protected their capital is on the downside, and how credible the governance structure will be after the round closes.
Turning Fully Diluted Modeling Into Investor Trust
Controlling the financing narrative starts with controlling the cap table. That does not mean adjusting the numbers. It means understanding, anticipating, and clearly explaining how ownership and dilution evolve under different conditions.
Five Steps That Build Investor Confidence
- Build scenario models showing outcomes at exit valuations such as $50 million, $100 million, and $300 million, with sensitivity to option pool size and SAFE conversion mechanics
- Clean up legacy overhang before raising: convert notes, reprice expired options, and reclaim equity from inactive stakeholders
- Align on fully diluted definitions across legal counsel and investor teams, including options, SAFEs, and reserved shares
- Visualize ownership evolution from pre-seed through Series C, including dilution from each round and every option pool refresh
- Tell the strategic story behind the numbers: why dilution occurred, how option grants built the team, and why the structure was intentional rather than accidental
Investors invest in clarity. A founder who can walk an investor through a cap table like a roadmap, anticipating questions and answering with precision, builds trust. That trust lowers perceived risk, and lower risk lowers the cost of capital.
Three Key Takeaways
- Fully diluted ownership, not the outstanding share count, is the number that determines real ownership percentage, valuation, and control in any financing round.
- Investors evaluate a cap table on five dimensions: liquidation preferences, preference stack depth, option overhang, ownership concentration, and SAFE or note overhangs. A CFO who models all five before a raise removes friction before it starts.
- Clean, well-documented fully diluted modeling builds investor trust faster than a strong pitch alone, because it signals governance discipline and lowers the perceived risk that drives the cost of capital.
Disclaimer: This article is intended for informational purposes only and does not constitute legal, financial, or investment advice. Please consult your professional advisors before making equity or cap table-related decisions.
Hindol Datta is a four-time CFO and senior finance executive with over 25 years of leadership experience across cybersecurity, SaaS, gaming, logistics, digital marketing, medical devices, consumer products, and nonprofit organizations. He has led more than $120M in fundraising and over $150M in M&A transactions while building the financial and operational systems that let complex businesses scale with confidence. He is the author of seven books in the Systems CFO Series and holds active CPA, CMA, and CIA credentials.
AI-assisted insights, supplemented by 25 years of finance leadership experience.