
Executive Summary
Throughput for CFOs is less about adding capacity everywhere and more about finding the one constraint that limits the enterprise. That constraint may sit in delivery bandwidth, decision speed, working capital, or engineering review cycles. Capital applied anywhere else adds pressure without adding flow, and the cost shows up as burnout, trapped cash, and thinner margins.
This article draws on the Theory of Constraints and throughput accounting to examine how bottlenecks form and migrate. It also shows why leverage works only when routed through the constraint, and what real organizations learned from misreading their limits. Finance leaders will find a practical model for sequencing growth and a sharper question for the next board meeting.
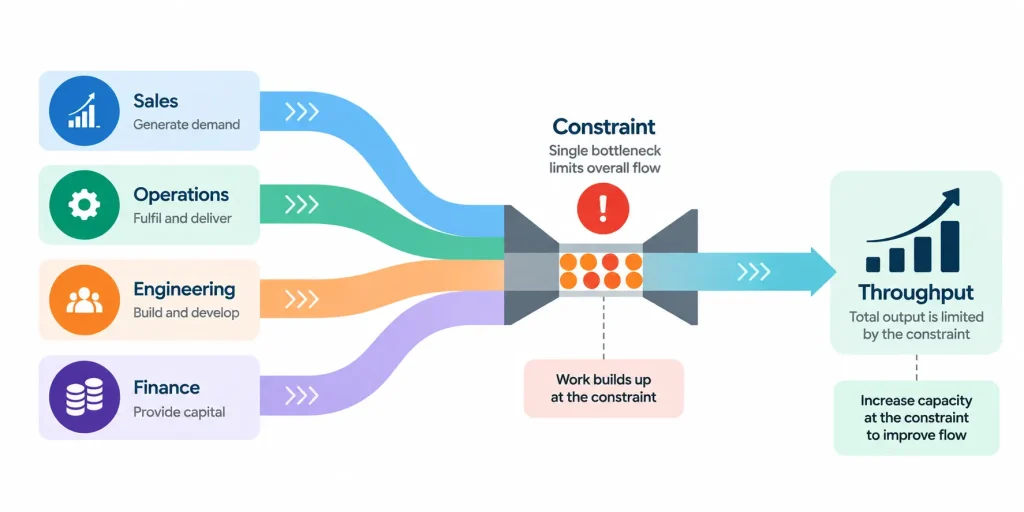
Why Throughput for CFOs Starts With Constraint
The idea of infinite flow, with capital that never runs short and markets that never saturate, is a comfortable fiction. Every enterprise operates under constraint, so the useful questions concern where it sits and how leadership responds. Eliyahu Goldratt put it plainly: an hour lost at a bottleneck is an hour lost for the entire system. Only one constraint governs total throughput at any given moment. Ignoring it wastes energy, while finding it shows where throughput for CFOs and their teams can compound.
The CFO role therefore extends beyond capital allocation into something closer to chief flow architect. That work means interpreting constraint, pacing throughput, and designing a system where pressure creates value instead of entropy. The bottleneck is not an enemy, because it marks the point where the truth of the system becomes visible.
Locating the Bottleneck Before Allocating Capital
A bottleneck is the least-capacitated, most-consequential link in the value chain. Improving any other link yields little until the binding one moves. Many firms still hire into sales while delivery capacity sits saturated, or add engineers while code review and QA govern the backlog.
Where Bottlenecks Hide in Modern Organizations
Physical bottlenecks, such as an overloaded machine, are easy to see. Knowledge-work bottlenecks are harder to spot and tend to take these forms:
- Decision bottlenecks, where approvals stall because authority or risk tolerance is unclear
- Data bottlenecks, where pipeline latency turns informed decisions into reflexive ones
- Psychological bottlenecks, where risk aversion or misaligned incentives block forward motion
- Working capital bottlenecks, where slow collections and fast payables choke cash velocity
- Valuation bottlenecks, where growth capital exists but a credible future story is missing
The diagnostic question is simple to ask and hard to answer: which single constraint, if elevated, would raise total output? Answering it means watching hiring queues, sales conversion lags, and time-to-decision on capital requests.
The Cost of Local Optimization
Each function tries to improve its own metrics, but improvement misaligned with the constraint backfires. Sales teams that accelerate bookings without delivery bandwidth create burnout. Procurement that minimizes unit cost at the expense of lead time hides a working capital burden. In one business unit, a 40% gain in design output only stacked unused designs behind a code-review bottleneck. Flow resumed after leadership paused design scale-up, reallocated engineers, and funded QA automation.
Throughput Accounting and Queue Analysis
Throughput accounting replaces cost allocations with a cleaner question: what generates throughput, and what consumes the constraint? Under this lens, labor becomes a resource whose time deserves protection for constraint-relieving work. Marketing spend becomes a throttle whose return depends on whether the limit sits in demand or delivery. At a cybersecurity company with roughly $30M in ARR, a driver-based capacity model made the delivery constraint visible. Tuning the mix of employees and subcontractors then held bench time under 5% to 7% through rapid growth.
Queue analysis complements this view, since long queues signal friction. One contract review process carried a 10-day SLA, and the cause was missing triage, not legal headcount. Value-based prioritization and parallel review for low-risk templates cut queue time in half.
Decision Velocity and Constraint Migration
The most overlooked bottleneck in many firms is decision velocity. Decisions stall when ownership, authority, or risk thresholds are unclear, even when information is plentiful. Slow capital is expensive capital, so the CFO must define who decides, on what basis, and at what threshold.
Bottlenecks also migrate as volume, mix, and context shift. Hiring velocity may bind one quarter, onboarding quality the next, and integration bandwidth six months later. Leaders often resist naming a constraint, yet constraint is information, and a rolling constraint map keeps capital pointed at the real limit.
Leverage Works Only Through the Constraint
Leverage in finance usually means debt, yet its deeper meaning is geometric. It concerns the fulcrum where a small, well-directed effort shifts the whole enterprise. A $1M marketing push may do less than $100K spent on backlog triage. Firms that raise at high valuations and pour capital into demand generation often watch delivery cycles balloon and NPS fall.
Structural Leverage Versus Fragile Acceleration
Consider two firms entering hypergrowth with similar funding. Firm A reinvests in headcount and customer acquisition, while Firm B invests in tooling and margin at the constraint. Both grow the top line, but only one of them compounds.
| Dimension | Structural Leverage (Firm B) | Fragile Acceleration (Firm A) |
| What it builds | Capacity | Exposure |
| Typical investments | Automation, cross-training, modular architecture, flexible contracts | Short-term financing, brittle pricing, incentives detached from capacity |
| Outcome by year three | Compounding retention, faster payback, higher operating leverage | Churn, margin contraction, morale drag |
Financial leverage still matters, but it needs constraint sensitivity. A credit line that speeds receivables conversion at a working capital bottleneck may return 4x. The same line used for speculative hiring can destroy value. During a scale-up from $9M to $180M in 24 months at a digital marketing company, CAC and LTV discipline kept growth tied to capacity.
Brand trust, narrative clarity, and reputation act as stored energy, yet they turn fragile when a vision outruns capacity. Scaling go-to-market ahead of retention shows the same timing risk, as bookings grow and churn follows.
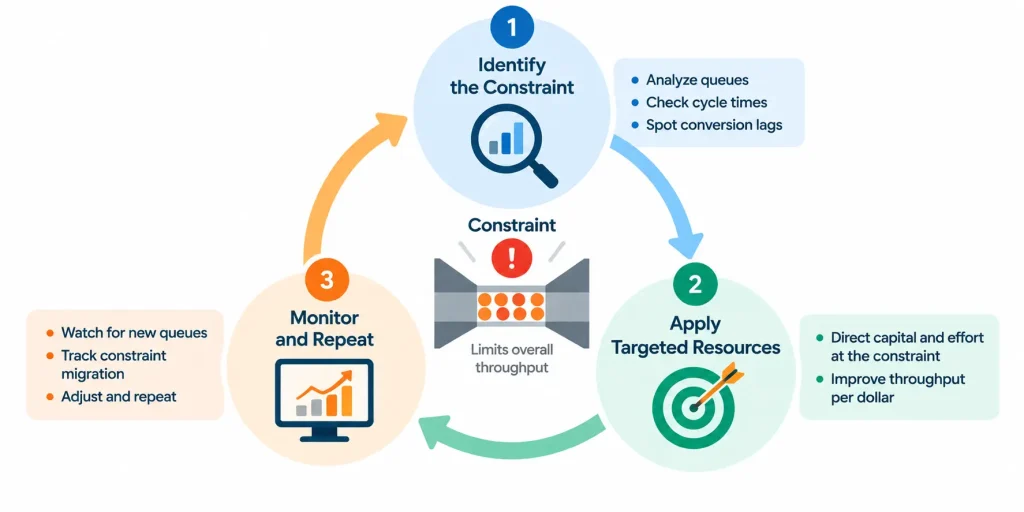
The Constraint Leverage Cycle
A three-step cycle turns leverage from a gamble into a managed release of energy. It builds tempered confidence, because scaling follows signals of readiness.
Lessons on Throughput for CFOs From Real Organizations
Real throughput for CFOs is tested when constraint shows up as delayed deals, stretched cash cycles, and eroding morale.
Case Comparison: Where the Constraint Sat
| Organization | Real Constraint | Where Force Went | Result |
| Connected-fitness brand, 2020 surge | Supply chain throughput | Hiring, warehousing, content, overhead | Longer lead times, then a fragile fixed cost base |
| Product-led collaboration software company | Customer enablement at scale | Automated acquisition; enterprise sales added after support matured | Margin preserved while scaling |
| Mid-market software firm after doubling ARR | Six-month implementation bandwidth | Geographic expansion | Revenue lag and churn until modular onboarding arrived |
| Global apparel brand | Distribution center capacity | Upstream manufacturing | Inventory build-up and discounting |
| Consumer packaged goods firm | Aging high-margin packaging line | Drum-buffer-rope pacing around that line | Higher inventory turns and capital efficiency |
| Fintech scaling R&D | Product management judgment | More engineers and sprints | Technical debt until product ops took over |
The connected-fitness case reflects a mistuning of sequence, where demand served as permission instead of pressure. The packaging-line case shows the opposite discipline, with the constraint setting the tempo for all other work.
A $127M global consumer products company offers a parallel lesson. SKU-level forecasting had become the hidden constraint, and overstock was its symptom. Demand planning and SKU rationalization lifted inventory turns from 3x to 7x and released trapped working capital.
Leading Under Constraint With Rhythm and Judgment
Constraint works as a form-giver, much as meter shapes a poem. Ambition urges acceleration, while the constraint answers with timing. Periods of cheap capital make constraints feel optional, yet they only move underground into onboarding, product debt, or decision queues. FP&A work in rail and transportation shows this plainly, since fixed infrastructure and variable throughput set the economics of every route.
Constraint also forces ethical tradeoffs, such as delaying expansion to protect customer trust. One COO, facing operational chaos, said clarity would return once everyone knew where the friction sat and stopped trying to fix it with more. The CFO becomes a conductor, and that clarity compounds into organizational judgment that outlasts market cycles.
A Constraint-Aware Model of Throughput for CFOs
The ideas above converge into one operating model that finance leaders can revisit every quarter.
The Constraint-Aware Leadership Model
| Principle | What It Requires |
| Locate the bottleneck | Look where throughput halts, not where the noise is loudest |
| Apply leverage through it | Route capital and effort through the constraint, never around it |
| Sequence growth | Pace expansion to operational readiness instead of ambition |
| Monitor migration | Update the constraint map with data and ground-truth observation |
| Lead with humility | Treat respect for constraint as stewardship, not weakness |
Boards often ask where the company can accelerate, but a stronger question asks where flow is already constrained and how to release it responsibly.
Three Key Takeaways
- Throughput for CFOs begins with locating the single binding constraint, because capital spent elsewhere adds pressure without adding flow.
- Financial, operational, and reputational leverage create value only when they pass through the constraint in step with readiness.
- Bottlenecks migrate as businesses grow, so constraint diagnosis belongs on the standing agenda as a rolling map.
Disclaimer: This article is intended for informational purposes only and does not constitute legal, tax, or accounting advice. You should consult your own tax advisor or counsel for advice tailored to your specific situation.
Hindol Datta is a four-time CFO and senior finance executive with over 25 years of leadership experience across cybersecurity, SaaS, gaming, logistics, digital marketing, medical devices, consumer products, and nonprofit organizations. He has led more than $120M in fundraising and over $150M in M&A transactions while building the financial and operational systems that let complex businesses scale with confidence. He is the author of seven books in the Systems CFO Series and holds active CPA, CMA, and CIA credentials.
AI-assisted insights, supplemented by 25 years of finance leadership experience.