
Executive Summary
The role of cost accounting reaches far beyond compliance. How a company measures its costs can either enable growth or quietly smother it. Behind gross margins sit allocation rules, burden rates, and overhead assumptions. These decide whether growth is profitable or merely looks that way.
The sections ahead explain how CFOs can rebuild cost accounting as a forward-looking design tool. They cover the industrial origins of costing, how faulty cost signals mislead growth, and how causal and Bayesian methods build a living cost system. They also address the courage required to act on what clear cost data reveals. Together they show cost accounting as the hidden architecture that channels capital, guides pricing, and supports durable expansion.
Why the Role of Cost Accounting Has Outgrown Its Industrial Roots
Traditional cost accounting emerged in factories, where overhead such as lighting, maintenance, and supervision had to be spread across standardized goods. Production was linear, labor was manual, and managers assumed costs rose in proportion to volume. Designers built the system to simplify complexity, not to reveal it.
When the Business Evolves but the Cost Model Does Not
Modern companies often run on platforms, software, services, and intangible assets. Their costs sit in codebases, vendor stacks, and skilled labor instead of machines. Many face high fixed costs, low variable costs, and margins that swing sharply by channel, cohort, geography, or product mix.
Traditional cost accounting flattens these differences into averages. Leaders armed with fully absorbed unit costs may compare products or channels using numbers that hide cross-subsidies and unpriced complexity. They optimize toward what the model calls profitable while margin leaks elsewhere.
Several approaches have tried to close this gap over the past four decades. Each solved part of the problem while creating new trade-offs.
Costing Approaches and Their Trade-Offs
| Approach | Core Idea | Strength | Limitation |
| Traditional absorption costing | Spreads overhead by volume, labor, or revenue | Simple and consistent | Hides cross-subsidies and complexity |
| Activity-based costing | Assigns overhead by the activities that consume resources | Reflects actual resource usage | Data collection can become heavy and costly |
| Throughput accounting | Focuses on contribution per unit of constrained resource | Highlights bottlenecks and flow | Works best where one constraint is clear |
| Lean and causal cost modeling | Links costs to value streams and operational drivers | Explains why costs arise | Requires better tools and cross-functional fluency |
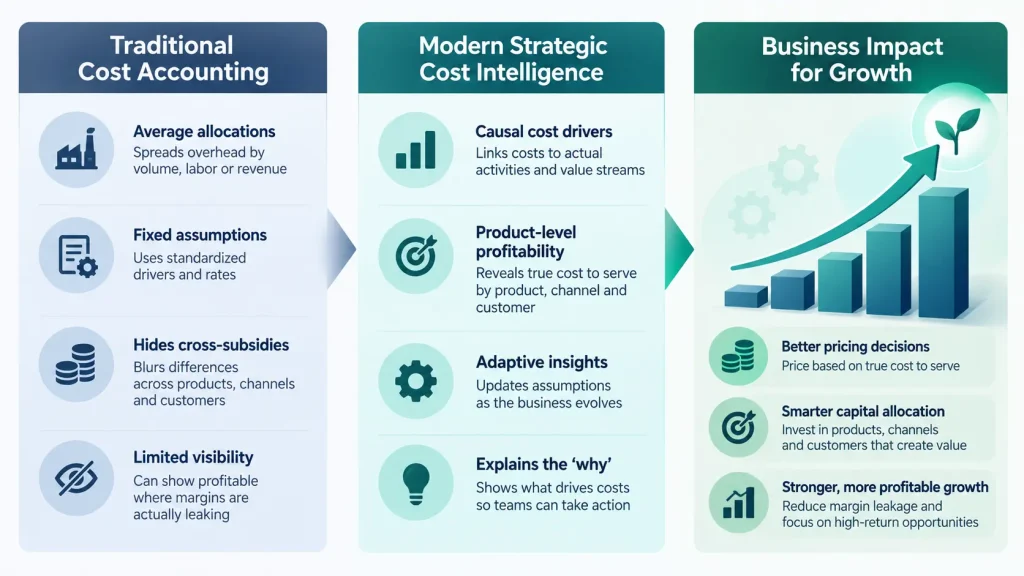
Activity-based costing, introduced by Robert Kaplan and Robin Cooper in the late 1980s, was a major advance. Yet many implementations collapsed under the effort of gathering granular data, and companies drifted back to simple proxies. Throughput accounting, rooted in Eliyahu Goldratt’s theory of constraints, fits manufacturing and distribution well but strains in software and services.
Outdated models persist partly through inertia in charts of accounts, ERP design, and audit routines. They also persist because they offer a comforting single number. A precise but wrong unit cost often feels safer than an honest range.
A $170M medical device manufacturer with operations in Copenhagen, Cork, and Taiwan illustrates the foundations that strong costing requires. Work as operations controller there involved standard costing and bill-of-materials management across multiple sites. Consistent cost structures across locations made product-level comparisons meaningful.
How Faulty Cost Signals Lead Growth Astray
Every scaling company eventually reaches a point where margins tighten despite rising volume. Burn grows faster than revenue, and new products cannibalize older ones in ways nobody can measure with confidence. Often the root cause is a cost system that sends the wrong signals.
Hidden Differences in Cost to Serve
Consider a SaaS company with three product lines that share infrastructure, sales, and support. Finance allocates customer success and platform costs by headcount or revenue, so each product appears to earn similar margins. Leadership then invests evenly across all three product lines.
In reality, one product is self-service, another needs high-touch onboarding, and the third drives most support tickets. An activity-based view might cut the contribution margin of the latter two by 15% to 20%. Because the model shows parity where divergence exists, capital flows to the wrong products.
Channel strategy suffers from the same kind of distortion. A direct sales channel may appear to beat partner sales on gross margin. Deeper modeling might show it consumes twice the sales expense per dollar of ARR and suffers higher churn from poor customer fit.
Infrastructure costs add another blind spot for many companies. One customer with unpredictable usage spikes may drive more hosting cost than ten smaller clients combined. If allocation ignores that strain, pricing stays flat while margin erodes.
When Distorted Costs Meet Incentives
The damage compounds when companies reward teams on metrics built from distorted costs. Sales may chase high-cost, high-churn customers, and product teams may favor features that win deals but inflate support. Capital decisions then rest on return curves built from faulty data.
These costing errors extend well beyond software companies. In consumer and logistics businesses, bundled SKUs may look profitable until analysis includes inventory carrying costs and fulfillment complexity. International markets may appear high-margin while absorbing outsized administrative and compliance expense.
A professional services firm with five business units shows the value of finding these hidden patterns. Finance built engagement-level profitability and utilization analytics from scratch. Those measures revealed where the business created margin and where it leaked.
The Role of Cost Accounting in a Living Cost System
If traditional cost accounting is a static map, growing companies need a compass that updates as conditions change. Cost is an inference built on assumptions about causality, behavior, and allocation. A good cost system absorbs new information instead of defending old assumptions.
Bayesian Updating and Causal Modeling
Bayesian thinking treats cost assumptions as beliefs that evidence should refine. Imagine a company launching a new channel with an initial CAC estimate of $400. As conversion, retention, and onboarding data arrive, the model updates, and clarity improves with each cycle.
Causal cost modeling links costs to the behaviors that create them instead of convenient proxies. Support costs offer a clear example of the difference.
Allocation Proxies Versus Causal Cost Drivers
| Cost Area | Common Allocation Proxy | Causal Driver |
| Customer support | Revenue share | Ticket volume and resolution time by segment and product |
| Onboarding | Number of customers | Implementation hours by customer type and complexity |
| Infrastructure | Revenue or seat count | Compute and storage usage, including peak demand |
| Sales | Even split across products | Sales cycle length and touches per deal by channel |
| Compliance and administration | Headcount | Regulatory requirements and transaction volume by market |
Causal models also enable useful what-if analysis for planning. A team can test how cutting ticket volume by 30% through better onboarding would change fully loaded CAC.
Separating Signal from Noise
Cost data often arrives lumpy and distorted by timing. An infrastructure spike may reflect load balancing instead of margin decline, and a dip in utilization may reflect mix instead of weaker demand. CFOs can reduce false alarms through a few practices:
- Show error bands around key cost metrics instead of single point estimates
- Use moving averages to smooth short-term volatility in cost data
- Flag anomalies without resetting long-term assumptions too quickly
- Record context such as launches, seasonality, and go-to-market shifts alongside cost data
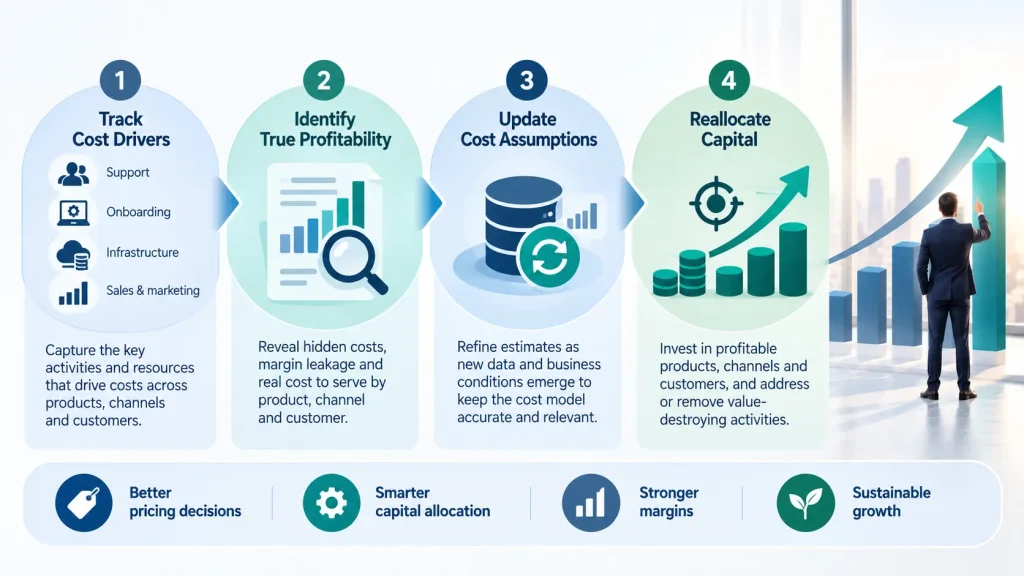
The cost model should also serve as a shared language across functions. Monthly causal cost reviews help operators connect daily decisions to financial outcomes. Framing insights as trade-offs, such as margin per support hour by segment, makes cost awareness about clarity instead of frugality.
A cybersecurity and identity SaaS company with about $30M in ARR shows how cost visibility supports margin gains. Finance contributed to a 12% increase in gross margin while keeping bench utilization under 5% to 7%. Clear insight into cost drivers made those improvements possible.
The Courage to Act on Cost Clarity
At some point, a refined cost model points steadily to an uncomfortable truth. A product may be destroying value, a customer cohort may be unprofitable, or a favored channel may be draining margin. Such clarity creates a new responsibility for leaders.
Turning Insight into Reallocation
Many well-built cost models end up shelved because their implications are politically costly. Leaders may defend a product that erodes EBITDA by 300 basis points as strategic, or keep an unprofitable channel as a presence play. Each rationalization holds some truth, yet capital stays misallocated in plain view.
Acting on cost clarity is difficult in practice. Retiring a product means reassigning teams and reworking compensation, while shifting go-to-market strategy means retraining staff and accepting forecast volatility. Delay is usually worse, because unprofitable lines keep dragging the average and hidden subsidies keep growing.
The CFO can frame these moves as strategic focus instead of austerity. Cost visibility should also be built into the decision process itself. That includes contribution metrics at every product review, capital approvals tied to marginal returns, and post-investment reviews that compare forecast and actual costs.
An email marketing SaaS company shows what decisive cost action can achieve. Finance reduced monthly cash burn from $800K to $200K. Cuts of that scale depend on clear visibility into which costs create value and which do not.
Three Key Takeaways
- The role of cost accounting has shifted from industrial compliance to strategic guidance, because averaged allocations hide cross-subsidies and unpriced complexity.
- Causal cost modeling and Bayesian updating turn cost accounting into a living system that reflects how each product, channel, and customer consumes resources.
- Cost clarity creates value only when leaders act on it, reallocating capital and retiring value-destroying products with transparency and resolve.
Disclaimer: This article is intended for informational purposes only and does not constitute legal, tax, or accounting advice. You should consult your own tax advisor or counsel for advice tailored to your specific situation.
Hindol Datta is a four-time CFO and senior finance executive with over 25 years of leadership experience across cybersecurity, SaaS, gaming, logistics, digital marketing, medical devices, consumer products, and nonprofit organizations. He has led more than $120M in fundraising and over $150M in M&A transactions while building the financial and operational systems that let complex businesses scale with confidence. He is the author of seven books in the Systems CFO Series and holds active CPA, CMA, and CIA credentials.
AI-assisted insights, supplemented by 25 years of finance leadership experience.