
Executive Summary
Executive dashboard design is no longer a matter of polish. The systems a CFO explains to a board are too interdependent for rows of numbers and bullet-heavy slides. Insight that cannot be seen is often misread, and a misread insight pulls the wrong lever at the worst moment.
This article examines why visual form matters to strategic communication and which visualization tools match the way executives decide. It applies those tools to capital planning, variance analysis, M&A, and board reporting, then closes with the cultural work that makes a CFO dashboard a shared frame of reference.
Why Executive Dashboard Design Matters When Language Falls Short
Every finance leader knows the silence that follows a well-prepared quarterly review. The numbers are correct and the commentary is crisp, yet the room still squints at a spreadsheet. The pattern the CFO already sees has not landed, and the cause is cognitive load, not skepticism.
Language moves in sequence, while the systems a CFO manages are nonlinear and interdependent. Costs respond to volume elasticity, currency noise, and marketing lag at the same time. When one insight must travel across five possibilities at once, prose becomes too slow a vehicle. A table fares no better on its own, because it reports variance without revealing what is changing or why it matters.
Reducing Noise in Financial Communication
Claude Shannon framed communication as the transmission of signal across noise, and a CFO report fits that frame well. Its success depends on the clarity of signal received, not on completeness. Thoughtful executive dashboard design cuts through enterprise noise because the human brain evolved to recognize form, not to parse tables.
A churn table may show an 11.4% spike, while a cohort decay curve shows the retention cliff with urgency. Ten scenario assumptions feel abstract in a list, yet a fan chart turns them into a visible range of outcomes. Visualization, in this sense, is cognitive infrastructure instead of decoration.
The Strategic Cost of Missing Shape
When a forecast miss is misunderstood, leadership pulls the wrong corrective lever. A correlation mistaken for causation sends the next campaign chasing noise. Capital cases presented only in text hide their true opportunity cost. The firm drifts, not for lack of data, but for lack of shape, so the working question becomes simple: what does this insight look like?
Five Visual Tools at the Core of Executive Dashboard Design
Executive cognition carries limits that everyone shares, including finite working memory and a preference for pattern over raw data. Boards misread margin movement not for lack of intellect but because the presentation ignores how decisions form. Strong executive dashboard design matches each visual to a specific decision.
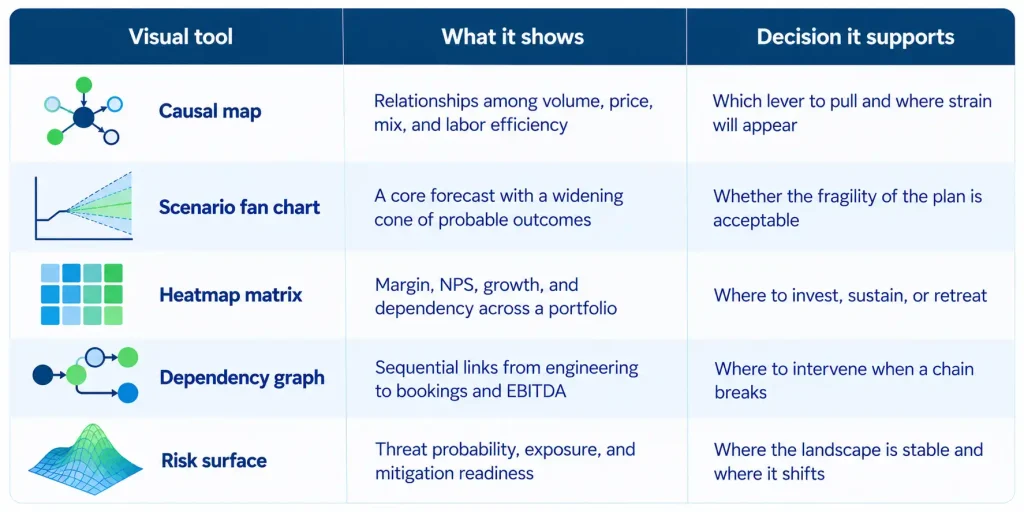
Visualization Tools Mapped to Executive Decisions
How Each Tool Earns Its Place
- Causal maps replace a catalog of separate slides with one canvas of drivers.
- Fan charts, borrowed from central bank practice, move the conversation from hope to calibration.
- Heatmaps expose opportunity cost, making a ten-SKU product line legible at a glance.
- Dependency graphs locate a broken link before budget variance appears.
- Risk surfaces give shape to cyber, litigation, compliance, and macro exposure.
Heatmap logic proved its worth at a $127M global consumer products company selling through DTC, Amazon, and wholesale channels. Raising inventory turns from 3x to 7x depended on SKU rationalization and demand planning. That work required leadership to see margin, velocity, and working capital for every product together.
Good dashboard design starts with strategic empathy, not aesthetics. The first question concerns the task the CEO is performing: choosing between alternatives, managing a constraint, making a bet, or revising an assumption.
Applying Financial Data Visualization Across Core CFO Functions
Large enterprises suffer a quiet tyranny of documents, with decks and appendices that look polished yet carry little shared insight. Visualization helps only when it restructures communication itself, so it should never sit on top of an old process as one more exhibit.
Visual Applications by CFO Function
| CFO function | Recommended visual | What it surfaces |
| Capital planning | Capital map across ROI, strategic fit, and capacity | Implicit trade-offs and resource congestion |
| Variance analysis | EBITDA bridge waterfall with assumption drift overlays | The anatomy of a miss, quarter over quarter |
| Scenario simulation | Probability-weighted decision tree | Distribution tails and inflection points |
| M&A diligence | Radial integration complexity chart | Where post-close drag sits |
| Board communication | Dynamic strategic map linking KPIs to drivers | KPIs in strategic context |
Capital Planning and Variance Analysis
Capital planning looks like a logic exercise but often plays out as political theater, with business units shaping narratives to flatter their models. A visual capital map reveals bets that look optimal alone yet destructive beside adjacent initiatives.
An EBITDA waterfall layered with assumption drift and execution slippage becomes a causal storyboard of the miss. At a cybersecurity and identity access management company with roughly $30M in ARR, a driver-based forecasting engine held actuals within plus or minus 5% of forecast for 8 consecutive quarters. Visible drivers in the reporting cadence meant variance discussions began with cause instead of defense.
Scenarios, M&A, and the Boardroom
Scenario visuals should reveal the contours of uncertainty instead of three static cases. Without them, fear overweights risk or narrative bias underweights it. In M&A diligence, a radial chart of integration complexity by function shows where post-close drag will concentrate. At a Euronext Paris-listed gaming company, more than $100M in cross-border M&A relied on one definition of revenue across subsidiaries in five countries.
Board communication requires a dashboard of consequence, where every KPI sits inside its strategic context. Board-ready executive dashboard design turns the update from a recital into a conversation of judgment. Once the model leaves the spreadsheet, the modeler stops being its sole interpreter.
Building a Culture That Reads the Executive Dashboard Together
A new dashboard often launches to admiration, and weeks later nothing has changed. Most organizations skim charts for confirmation, and when a visual contradicts a story, the story wins because someone owns it. Sustainable executive dashboard design therefore depends on two acts of cultural leadership.
Ritualizing Visual Communication
Ritualization embeds standard visuals into the operating cadence of the firm:
- Scenario fan charts in quarterly planning
- Capital maps in investment committee offsites
- Dependency graphs in product launch reviews
- Risk surfaces in board preparation
Repeated over time, these visuals become institutional memory. At a mission-driven education and research institution in Silicon Valley, trustees from varied backgrounds reviewed funding scenarios behind a $37M raise. A stable reporting format let them track change instead of relearning the page.
Coaching Interpretation
Interpretation coaching casts the CFO as visual educator during every review. Useful prompts ask what steepens the slope of a forecast cone, or which trade-off a shift in heatmap intensity implies. This habit moves teams from defending their numbers toward exploring their structure.
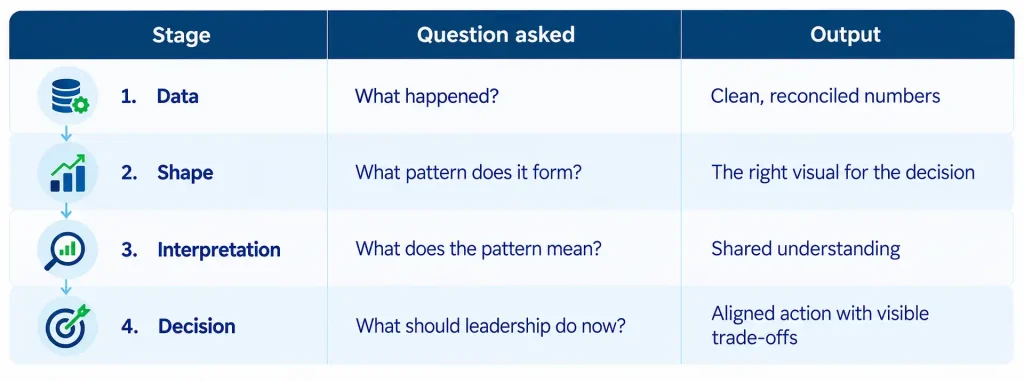
From Data to Decision: A Four-Stage Flow
Design Principles That Keep Executive Dashboards Honest
Poor design misleads and overdesign distracts, so good executive dashboard design follows a short set of principles:
- Clarity above cleverness
- Consequence above completeness
- Narrative coherence above dashboard overload
- One governing question for every visual: what decision does this make better?
When that ethic holds, the quarterly business review becomes an interpretive forum instead of a monologue. The boardroom becomes a place of shared cognition, and the CFO acts as a cartographer of judgment for the whole enterprise.
Three Key Takeaways
- Executive dashboard design is cognitive infrastructure, because interdependent financial systems cannot be grasped through sequential prose or raw tables. Every visual should begin by naming the decision it must improve.
- The tool should match the task, with causal maps for levers, fan charts for fragility, heatmaps for trade-offs, dependency graphs for sequence, and risk surfaces for exposure.
- Visual tools endure only when the surrounding culture supports their use. Ritualizing standard visuals and coaching interpretation moves executive discussion from individual opinion toward shared observation.
Disclaimer: This article is intended for informational purposes only and does not constitute legal, tax, or accounting advice. You should consult your own tax advisor or counsel for advice tailored to your specific situation.
Hindol Datta is a four-time CFO and senior finance executive with over 25 years of leadership experience across cybersecurity, SaaS, gaming, logistics, digital marketing, medical devices, consumer products, and nonprofit organizations. He has led more than $120M in fundraising and over $150M in M&A transactions while building the financial and operational systems that let complex businesses scale with confidence. He is the author of seven books in the Systems CFO Series and holds active CPA, CMA, and CIA credentials.
AI-assisted insights, supplemented by 25 years of finance leadership experience.