Executive Summary
A dynamic scorecard gives corporate vision the structure it often lacks. Many vision statements promise transformation or world-class excellence, yet few companies can say how they would know the vision is becoming real. Without that link, strategy turns episodic, execution fragments, and the company drifts despite its dashboards.
The sections ahead explain how CFOs can use a dynamic scorecard to translate vision into evidence. They cover vision as a constraint on choice, adaptive scorecard design, and the scorecard’s role in executive and board dialogue. They also address the culture needed to keep measurement honest. Together they present the scorecard as a compass that moves with strategy, not a static report.
Why Corporate Vision Needs a Dynamic Scorecard
The CFO may not author the vision, but the role carries responsibility for verifying it. That responsibility starts with one uncomfortable question: how would the company know if its vision were becoming real? Answering it requires a measurement system grounded in consequence.
Vision as a Constraint on Choice
A useful vision limits what the company will do as well as describing what it wants. Strategy depends on resource exclusion, because a company that chases every opportunity masters none. A vision begins to shape decisions only when it rules certain paths out.
Consider a company that calls itself the most trusted partner in digital security while cutting corners on privacy standards to protect margin. Its vision is not ambiguous; it is incoherent. The vision never constrained a choice, so it functioned as a slogan.
The CFO can help make vision testable by stating what must also be true if the vision holds. A vision to redefine urban mobility, for example, must eventually show up in margin structure, customer outcomes, engineering capability, and learning speed. Framed this way, the vision becomes a long-term hypothesis instead of a fixed claim.
That framing explains the purpose of a dynamic scorecard. It asks each quarter whether the company grew, and also whether it grew in the direction of its stated identity. A company can hit quarterly targets while drifting from its purpose, and only this kind of recursive check exposes the gap.
Translating Vision into Scorecard Domains
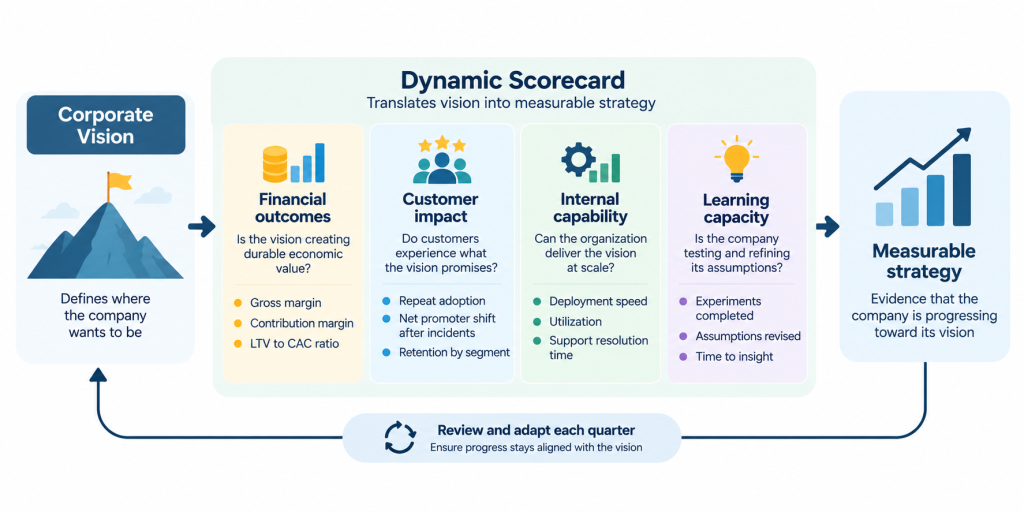
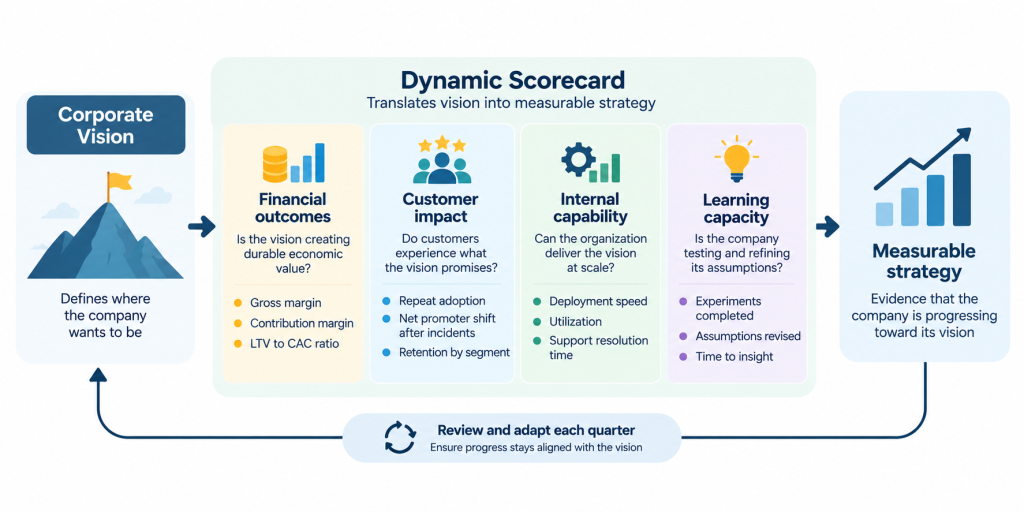
| Domain | Question It Answers | Example Metrics |
|---|---|---|
| Financial outcomes | Is the vision creating durable economic value | Gross margin, contribution margin, LTV to CAC ratio |
| Customer impact | Do customers experience what the vision promises | Repeat adoption, net promoter shift after incidents, retention by segment |
| Internal capability | Can the organization deliver the vision at scale | Deployment speed, utilization, support resolution time |
| Learning capacity | Is the company testing and refining its assumptions | Experiments completed, assumptions revised, time to insight |
These four domains echo the familiar balanced scorecard structure. The dynamic version differs in how it evolves and links each metric to the vision.
Designing a Dynamic Scorecard That Evolves with Strategy
Industrial-era scorecards listed throughput, yield, and defect rates in fixed rows. Modern visions are more fluid, so their measurement must adapt. The first principle of dynamic scorecard design is that no single metric is permanent.
Measure Causes, Not Only Outputs
Revenue reflects strategy but is not the strategy itself. Margin often lags results and absorbs outside influences. A dynamic scorecard should capture the causal structures that produce those outcomes.
If a vision centers on trust, the scorecard must ask what behaviors and capabilities produce trust for customers. Proxy metrics can make that abstract idea concrete. Examples include repeat adoption, support resolution speed, compliance transparency, and net promoter shifts after incidents.
Information theory offers a useful test for each metric. A metric that is easy to collect but hard to interpret adds noise. A metric that is precise but tied to no decision wastes attention. The best scorecards deliver the most decision-relevant signal in the smallest, most understandable form.
Operate at Three Altitudes
A dynamic scorecard works best when it connects strategy, execution, and learning in one view. Each altitude answers a different question for a different audience.
The Three Altitudes of a Dynamic Scorecard
| Altitude | Core Question | Typical Users |
|---|---|---|
| Strategic | Is the company progressing toward its directional intent | Board, CEO, and executive team |
| Operational | Is execution resourced, coordinated, and disciplined | Functional leaders and FP&A |
| Learning | Which feedback loops are refining the company’s assumptions | Strategy, product, and analytics teams |
When all three altitudes align, leaders can explain why results moved, not just whether targets were met. That understanding lets them project how the business will behave under changed conditions.
Track Momentum and Allow Disciplined Revision
Complexity theory warns that small variations can create large divergences in adaptive systems. A strong scorecard therefore tracks the slope and volatility of each metric as well as its level. A 92% retention rate may look healthy, yet a falling trend in a key segment can signal dissatisfaction before results decline. Each metric should also be explainable in plain cause-and-effect language across functions.
A dynamic scorecard must evolve without losing its memory. Too much rigidity turns it into a ceremonial report, while constant change destroys comparability. Clear criteria help strike the balance, and metrics should change only when one of these conditions applies:
- The underlying business model changes in a material way
- A new dominant strategic question emerges for leadership
- Longitudinal data disproves a key causal assumption in the model
Space for qualitative signals matters as much as hard metrics. Emerging behaviors and unexplained patterns often point to the next strategic opportunity before standard metrics capture it.
A Euronext Paris-listed gaming company with subsidiaries in five countries shows why consistent definitions underpin any scorecard. A firmwide rollout of Oracle Financials and MicroStrategy created a single definition of revenue across every subsidiary. That shared foundation allowed leaders to compare performance across markets on equal terms.
Leading Strategic Dialogue Through the Dynamic Scorecard
An elegant scorecard that executives ignore delivers no value. Metrics succeed or fail based on how well they enter human judgment. The CFO’s role is to make the scorecard part of the conversations where decisions happen.
From Grades to Narrative Deltas
Most companies treat metrics as history, but a dynamic scorecard looks forward. Each metric is a time series with an expected trajectory implied by the strategy. The CFO can focus discussion on whether actual curves match those expectations and what any gap suggests.
This shift moves dialogue from blame toward inquiry. Imagine customer NPS falling four points in a quarter. Instead of reacting, the CFO can ask whether implementation delays drove the drop. A follow-up question is whether such delays have tracked with account size or region. The scorecard then works as a map of reasoning instead of a report card.
Board communication benefits from the same approach to evidence. A CFO might explain that a metric tests whether one segment delivers higher expansion at lower acquisition cost. If evidence shows it does not, the CFO can describe how the metric and marketing allocation will change.
A Defense Against Strategic Drift
Every company faces temptations to chase adjacent markets, customize for a major client, or stretch margins to meet guidance. A well-built dynamic scorecard helps leaders test these moves against the vision. Imagine an expansion that would lift revenue 4% but reduce the LTV to CAC ratio by 20%. Framed through the scorecard, that trade-off becomes a clear, evidence-based reason to decline.
A venture-backed digital marketing company that grew from $9M to $180M in revenue shows the value of disciplined unit metrics. Finance built CAC, LTV, and contribution margin frameworks to guide growth decisions. Those measures kept rapid expansion tied to sound economics.
Building a Culture Around the Dynamic Scorecard
Even a well-designed scorecard can lose relevance in an indifferent culture. Treated as dogma, metrics invite gaming; treated as theater, they invite neglect. The goal is a culture that thinks with metrics without becoming captive to them.
Teaching Interpretation as a Shared Skill
The CFO can teach teams to ask a consistent set of questions about any metric. What does it assume, what does it omit, and what leads or lags it? Most important, what evidence would disprove the current interpretation?
Interpretation must live in the rhythm of management, not in a monthly PDF. Weekly reviews can begin with scorecard signals, and project launches can map to its structure. Leaders should explain strategic pivots as responses to what the scorecard revealed.
Contradictions between metrics deserve particular attention from finance leaders. When leading and lagging indicators diverge, the gap often shows where a model needs revision. Breaking broad figures such as net revenue retention into drivers like onboarding speed also helps frontline teams see their impact.
The CFO must also guard against performative precision, where teams sandbag targets or shape data to look in control. An honest miss teaches more than a managed win. A scorecard archive that records metrics, interpretations, and resulting decisions preserves how the company learned over time.
A marketplace SaaS company with operations in the United States and Poland shows how trusted metrics support credibility. Cohort and unit economics models anchored investor diligence during a $20M Series B. Clear, consistent measures gave investors confidence in how the business created value.
Three Key Takeaways
- A dynamic scorecard turns corporate vision into testable beliefs by linking financial, customer, capability, and learning metrics to strategy.
- Effective scorecards measure causes as well as outputs, track momentum, operate at three altitudes, and change only under clear revision criteria.
- The scorecard creates value when the CFO uses it to guide executive and board dialogue and builds a culture that interprets metrics honestly.
Disclaimer: This article is intended for informational purposes only and does not constitute legal, tax, or accounting advice. You should consult your own tax advisor or counsel for advice tailored to your specific situation.
Hindol Datta is a four-time CFO and senior finance executive with over 25 years of leadership experience across cybersecurity, SaaS, gaming, logistics, digital marketing, medical devices, consumer products, and nonprofit organizations. He has led more than $120M in fundraising and over $150M in M&A transactions while building the financial and operational systems that let complex businesses scale with confidence. He is the author of seven books in the Systems CFO Series and holds active CPA, CMA, and CIA credentials.
AI-assisted insights, supplemented by 25 years of finance leadership experience.