
Executive Summary
Cohort financial analysis gives a CFO what consolidated metrics cannot, which is a view of how revenue, margin, and retention behave over time for groups of customers who entered the business together. Averages compress that behavior into a single figure and hide the drift, the decay, and the early strength that a finance leader needs to see before quarterly totals confirm them.
This article explains why averages mislead, how to build cohorts that expose economic behavior, how to use them for performance management, and how to turn cohort thinking into an organizational habit. Readers will leave with a working framework for retention analysis, LTV and CAC payback tracking, and early warning signals.
Why Averages Fail Financial Leaders
An average carries a dignified calm that conceals contradiction. A reported customer lifetime value of $2,200 says nothing about the customers acquired through organic search a year earlier, who produced $3,400 and were declining, or about those from a newly launched referral program, who produced $1,150 and held steady. The figure offers closure without comprehension, and performance management cannot run on closure alone.
The Cost of Temporal Flattening
Averages collapse months and years of behavior into a single unit, so it becomes impossible to tell whether customers who stay beyond Month 6 grow more loyal or simply more inert. Growth driven by expanded utility looks identical to growth driven by the brief enthusiasm of new adopters who later leave. Survivorship bias and recency bias enter through that gap.
In a venture-backed digital marketing company that scaled from $9M to $180M in 24 months, the consolidated totals looked healthy for most of the climb. Only the customer acquisition cost, lifetime value, and contribution margin work performed by acquisition period showed which channels were building durable value and which were borrowing against future retention.
Why Cohorts Preserve the Signal
A segment is a snapshot while a cohort is a film, following a group that entered the firm’s economic orbit together and recording what becomes of it. Each cohort also carries the memory of the strategy in force at its arrival, including the price charged, the message sent, and the support offered. An average discards information, whereas a cohort view keeps more of the original signal.
Building a Cohort Financial Analysis Framework
The foundation of any cohort analysis is a clear marker of economic commitment, applied with rigor and consistency.
- Subscription businesses usually anchor on the moment of first payment.
- Consumer marketplaces anchor on the date of first purchase.
- Enterprise models anchor on the day of contract signature.
From Marker to Decision
Once the marker is set, the cohort is tracked longitudinally through a time matrix, and each curve becomes a conversation between what the business believed at acquisition and what the customers proved afterward.
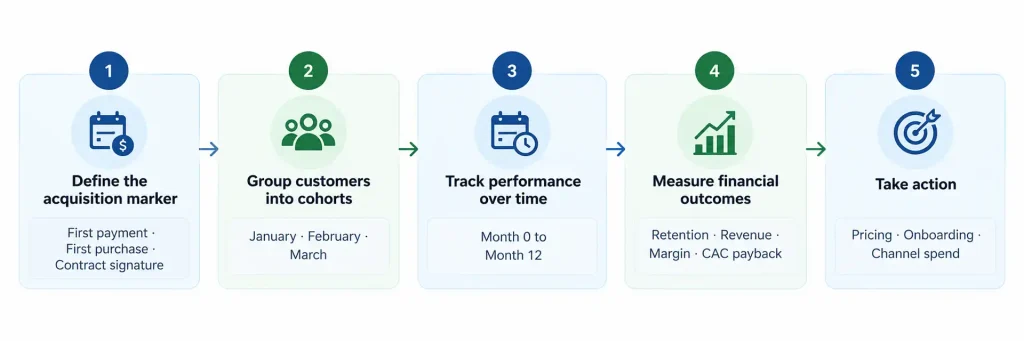
The unit of time defines the resolution of insight. Weekly cohorts suit high-frequency consumer behavior, quarterly cohorts suit enterprise models with long onboarding cycles, and monthly cohorts sit between them. A unit that is too coarse hides meaningful shifts, while one that is too fine lets noise overwhelm signal.
Reading the Retention Matrix
The illustrative table below shows retention by acquisition month, where the January cohort falters after Month 3, the February cohort never recovers, and the March cohort dips early before stabilizing.
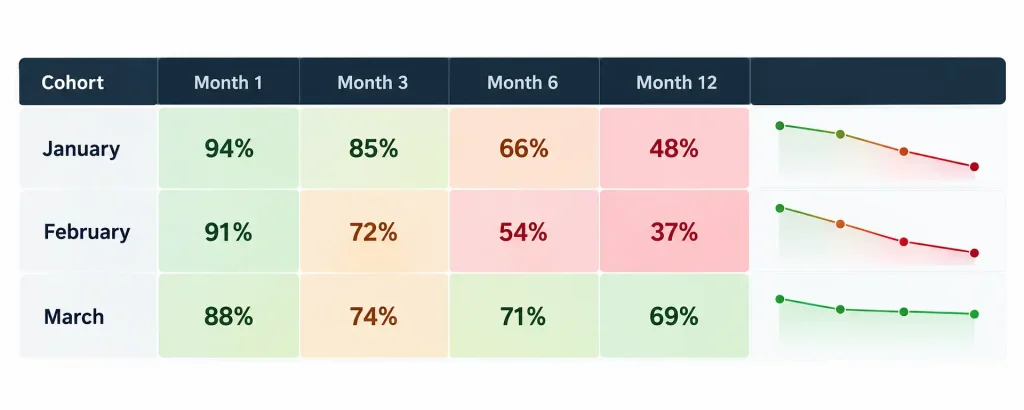
Averaging these rows would produce a smooth curve that describes none of them. The metrics worth including are those that change with time.
- Retention rate by cohort month, showing stickiness or abandonment.
- Cohort revenue curves, showing expansion, contraction, or decay.
- Margin progression, showing cost to serve as customers age.
- Contribution curves, showing when a cohort repays its acquisition cost.
Cohorts are built for narrative illumination and not for dashboard decoration, so metrics that do not move with time should stay out. A single cohort observed alone is an anecdote, but several cohorts aligned by age become a hypothesis engine that can test whether a pricing shift or an onboarding change altered first-quarter engagement.
Cohort curves also give the CFO lead time. A decline in Month 2 retention for a new cohort may not reach ARR for another quarter, yet it signals weakening customer trust long before the revenue line confirms it.
Using Cohort Financial Analysis for Performance Management
Margins, retention, and revenue per user change with context and incentives, so cross-sectional views miss their movement.
Margin and Retention Diagnostics
Aggregate gross margin can look stable while newer cohorts start lower because of onboarding cost or initial discounting. The useful question is whether Month 6 margin exceeds Month 2 for each cohort, and if it does not, whether service has failed to scale or usage has diverged from assumptions. In a professional services firm that grew from $12M to $63M in eight months across five business units, engagement-level profitability analytics gave leadership its first clear view of where margin was being created and where it was quietly leaking.
Retention deserves the same treatment, because an average monthly churn rate may meet benchmarks while Month 1 churn spikes for new cohorts and legacy cohorts hold. That pattern points to onboarding, product readiness, or unmet expectations, and it moves the CFO from reactive reporting toward prescriptive action.
CAC Payback and LTV to CAC by Cohort
Customer acquisition cost is only meaningful when paired with time to payback. A cohort view shows when each acquisition group crosses into net contribution, and if newer cohorts take longer to repay, channels may be drifting toward low-intent buyers or product fit may have weakened.
During a Series B raise at a marketplace SaaS company, cohort analysis and unit economics models anchored investor diligence and held up under scrutiny during a $20M round. A rolling dashboard applies the same logic by showing LTV to CAC at Month 3, Month 6, and Month 12 for every acquisition cohort over a two-year horizon. In one hypergrowth engagement, early cohorts reached 2.5x by Month 12 while recent ones plateaued at 1.3x, which revealed that scale had eroded quality and led to a pricing reset and a reallocation of marketing spend.
Forecasting and Early Warning
Cohort analysis is also a forecasting lens, especially during downturns, when new cohorts may activate later or churn sooner than historical baselines suggest. Each cohort behaves as a stochastic process, so expected curves are modeled and deviations are watched in real time. If Month 2 drop-off exceeds one standard deviation from historical norms, a diagnostic is triggered immediately and does not wait for quarter-end. In a high-growth cybersecurity and identity SaaS company, a driver-based forecasting engine built on this kind of behavioral discipline held actuals within plus or minus 5% of forecast for 8 consecutive quarters.
Making Cohort Financial Analysis a Company Habit
Cohort thinking becomes culture quietly, when meetings shift from asking about average LTV to asking how the Q4 cohort is tracking into Month 7. Product describes launches by their effect on Month 4 retention, and marketing calibrates spend by cohort recovery curves.
Teaching the Language
The CFO has to narrate as well as analyze, surfacing questions such as what happened in Month 5 and why late-year cohorts expand faster. One company formalized this through a monthly Cohort Council, a storytelling forum where Product, Marketing, Support, and Finance each presented one cohort curve with an interpretation of what it meant for planning. Conversations became more investigative, less defensive, and more willing to anticipate patterns.
Building It into Systems
Cohort tracking cannot depend on ad hoc requests to overburdened analysts. It belongs in the data infrastructure, in performance reviews, in OKR planning, and in product roadmaps, so that every team asks what the last cohort taught the business.
Cohort reporting also protects against narrative manipulation, since executives who must present the curve cannot cherry-pick data, and the curve shows what was promised and what was delivered. That visibility builds patience as well, because value is a path and some paths run crooked before they climb.
Three Key Takeaways
- Replace consolidated averages with cohort curves for retention, revenue, margin, and CAC payback, since averages hide the drift that determines future performance.
- Choose one consistent acquisition marker and a time unit that fits the sales cycle, then compare aligned cohorts to locate early warning signals months before they reach reported revenue.
- Embed cohort financial analysis in forecasting, planning, and board reporting so that every function manages behavior over time and not only results in the current period.
Disclaimer: This article is intended for informational purposes only and does not constitute legal, tax, or accounting advice. You should consult your own tax advisor or counsel for advice tailored to your specific situation.
Hindol Datta is a four-time CFO and senior finance executive with over 25 years of leadership experience across cybersecurity, SaaS, gaming, logistics, digital marketing, medical devices, consumer products, and nonprofit organizations. He has led more than $120M in fundraising and over $150M in M&A transactions while building the financial and operational systems that let complex businesses scale with confidence. He is the author of seven books in the Systems CFO Series and holds active CPA, CMA, and CIA credentials.
AI-assisted insights, supplemented by 25 years of finance leadership experience.