
Executive Summary
This article summarizes a four part series on strengthening board capabilities through interactive dashboards. Part one diagnoses the core problem with legacy board reporting. Static decks give directors a retrospective, curated view of the business. That view leaves little room for real inquiry. Part two lays out the design principles that make dashboards genuinely board ready. The focus sits on clarity, context, and controlled depth rather than raw data volume. Part three addresses the governance and trust infrastructure a dashboard needs. This covers data alignment, access discipline, and security before any director should rely on it. Part four explores how dashboards get embedded into the actual rhythm of board engagement, so they become a living system rather than a one time upgrade. Together the four parts argue that boards do not need more information. They need better access, sharper context, and tools built for genuine oversight rather than passive review.
Why Interactive Dashboards Expose the Limits of Legacy Reporting
In most boardrooms, clarity should triumph over clutter. Too often it does not. Board packets still arrive as thick decks, filled with static charts and linear narratives. Directors read them thoroughly, yet they engage with them passively. That gap between volume and insight is exactly where stronger board capabilities begin to matter.
Board reporting has followed the same pattern for decades. Management prepares a long deck and distributes it in advance. The team walks through it slide by slide in the meeting itself. Everyone leaves with the same curated version of events. This process feels thorough on the surface. It is also increasingly out of step with how fast modern enterprises actually move.
Not every static report is a poor one. Many organizations produce genuinely thoughtful board books, built with real analytical care. Even the best of these decks still share the same constraints. The narrative stays fixed, the granularity stays shallow, and the exploration stays linear. Directors can read a good deck closely and still only engage with it passively, since the format itself never invites a second question.
The Cost of Reporting in Fixed Intervals
Supply chains shift within hours. Customer sentiment can turn within a day. Risk exposure changes with every policy update or competitor move. Yet many boards are still reviewing metrics that are more than a month old. Directors end up evaluating live judgment calls with tools that only look backward.
This mismatch creates three predictable breakdowns. Directors become reactive rather than advisory, since a problem has usually matured by the time they see it. Board conversations anchor in the past instead of orienting toward what comes next. Opportunities get missed too, not because directors lack intelligence, but because they lack proper instrumentation.
Where Legacy Formats Break Down
A polished slide deck can still be brittle in practice. Any deviation from the planned agenda forces a director to flip through appendices. Sometimes it means waiting an entire cycle for a follow up email instead. That lag quietly discourages tough questions in the room. A few patterns show up again and again in organizations still relying on static formats:
- Metrics arrive weeks after the events they describe, so decisions get made on stale information
- Directors can spot a trend but rarely reach the underlying assumption behind it
- Every function below the board already works from real time data, from finance to sales to product
Boards are increasingly asked to weigh in on complex, fast moving topics. Cybersecurity, ESG, and geopolitical risk sit high on that list. Lagging indicators alone cannot support that kind of judgment. Directors need pattern recognition and the ability to test a hypothesis, not just a summary someone else already filtered on their behalf.
Real Time Fluency Everywhere Except the Boardroom
Across the rest of the enterprise, real time data is already the norm. Finance leaders track working capital daily. Sales teams monitor pipeline conversion hourly. Product managers run live experiments and adjust within days. Yet the most senior governing body in the company often remains bound to static PDFs and retrospective narration. That gap is not just operational. It is strategic, and it steadily narrows the range of judgment a board can actually apply.
Some organizations have already closed part of this gap inside their audit and risk committees. Financial dashboards there now track revenue mix, liquidity exposure, and budget variance in something close to real time. That progress rarely extends to the full board yet. Bringing the same discipline to the entire governing body is the next frontier for stronger board capabilities.
Designing Dashboards That Strengthen Board Capabilities
An interactive dashboard is only as valuable as the question it helps a director answer. The goal of design is not to compress more data onto one screen. It is to curate exactly the right information. That structure is what keeps governance sharp rather than overwhelmed.
Clarity, Context, and Control
Every dashboard should answer one core question. What decision or oversight responsibility does this actually support. A financial view should show where operating leverage is shifting. A talent view should show where engagement or turnover deviates from plan. Without a clear use case, a dashboard becomes ornamental rather than useful.
Numbers alone rarely tell the full story. A churn rate can look fine sitting in isolation. It becomes material once compared against last quarter, or once traced to a high value segment. Good dashboards anchor every figure with historical trend and peer benchmark where available. A short qualitative note helps too. This context is what actually builds board capabilities over time, since directors learn to read data the way management already does.
Navigation matters just as much as content. Boards will not learn a complex new tool every quarter. Dashboards should load quickly and pivot naturally from a macro view down to operating detail. A common mistake is porting an internal executive dashboard straight into the boardroom. That approach buries directors in operational telemetry they were never meant to review in the first place.
A Tiered Model for Depth Without Overload
Many organizations solve this by building a tiered structure instead of one flat view.
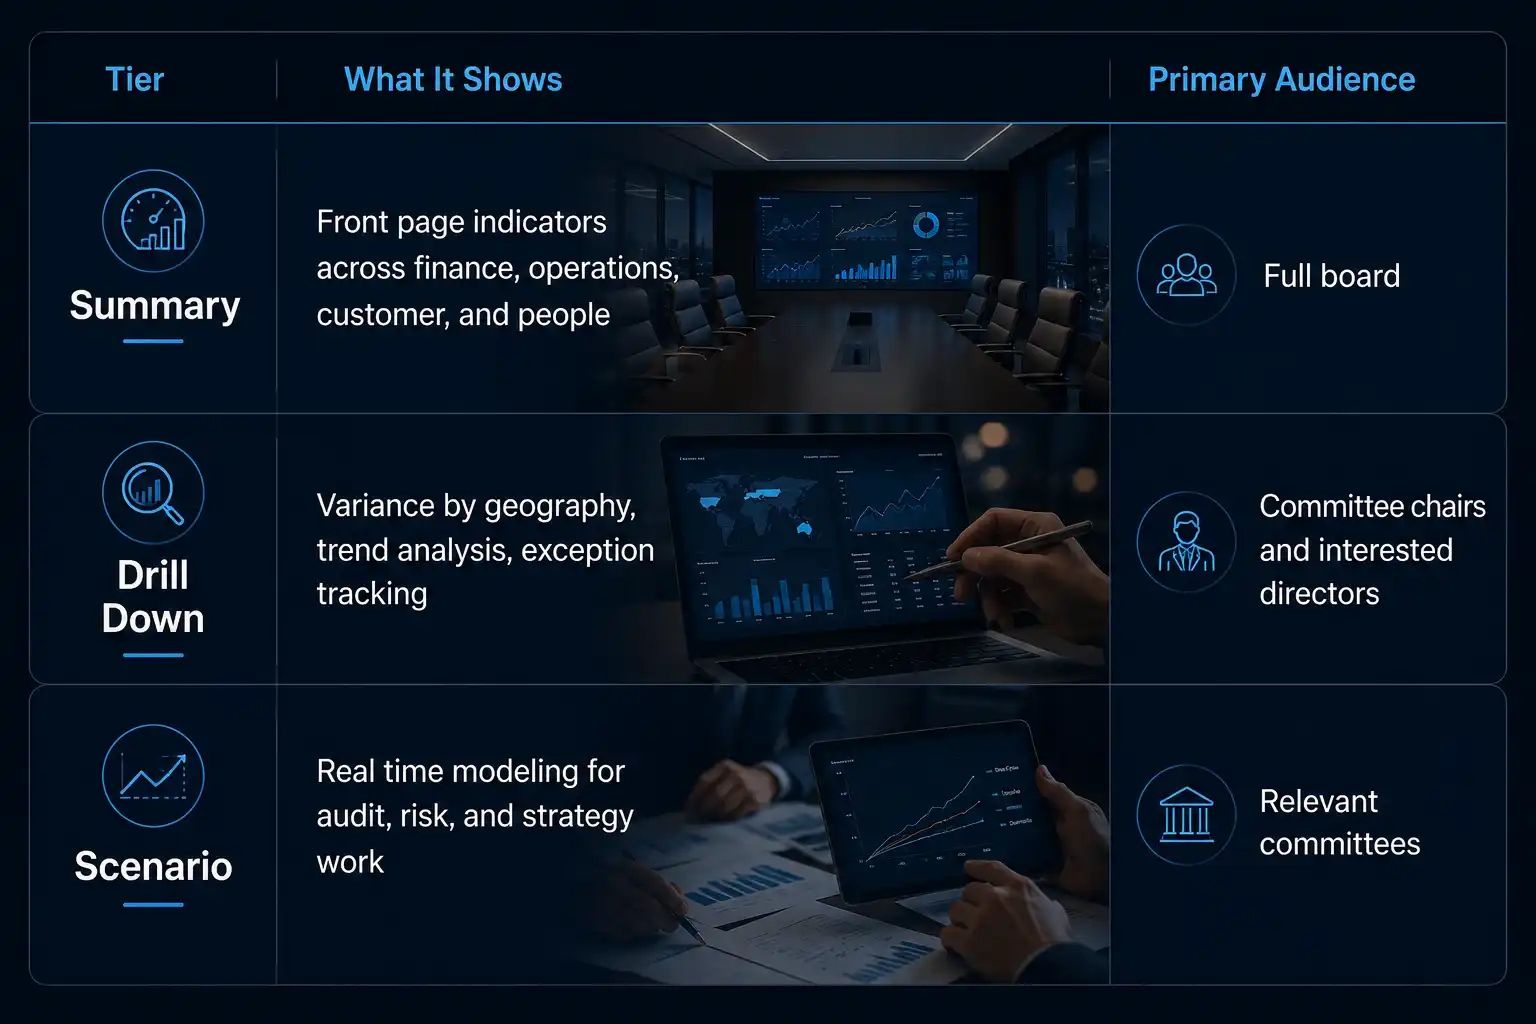
Storytelling still belongs inside this structure. A brief narrative next to a chart helps considerably. Noting that renewals in one region drove a revenue gain, while shipping costs pressured margin, prevents misreading the visual alone. A well designed dashboard also flags an inflection point automatically. It should not wait for a director to stumble across it during a live session.
Designing for Dialogue, Not Just Display
A strong dashboard anticipates the questions directors are likely to ask before the meeting even starts. If employee engagement drops sharply in one business unit, the dashboard should flag that shift rather than simply display it. If churn stays flat overall but rises among strategic accounts, that detail should surface automatically too. Automation and alerting add real value here. The goal is never to ping directors constantly. It is to surface what matters exactly when it matters most.
Security Woven Into the Design Itself
Design and protection cannot be separated once material nonpublic information sits inside a tool. Role based access, encryption, and session timeouts belong in the design brief from day one, not bolted on afterward. Any update made after a report circulates needs a visible record of what changed. That habit alone prevents a quiet source of confusion during the next board cycle.
Governance and Trust Behind Every Number
Design alone cannot carry a dashboard into the boardroom. Trust in the data, the access controls, and the underlying systems matters just as much. Directors only rely on what they can verify. Governance has to be treated as a foundational requirement rather than an afterthought.
Data Alignment and Access Discipline
Most companies keep data scattered across separate systems. Finance sits in one, operations in another, and people data in a third. Each system defines its own terms and its own timing. Before a dashboard reaches the board, these systems need a shared definition of core terms. Revenue, retention, and margin all need one consistent meaning across every view. Without that alignment, the same metric can show two different numbers depending on which screen a director opens.
Access needs the same discipline. Directors are fiduciaries, not employees. They need strategic performance data rather than every operational detail. An audit chair may need deep access to risk metrics. A governance committee may only need culture and succession indicators instead. Tiered access controls, matched to committee role and legal exposure, keep that boundary clear and defensible.
Security, Version Control, and Ethical Reporting
Boards are prime targets for cyber threats. Merger plans, executive performance data, and risk scenarios all sit inside their reporting tools. Multi factor authentication, encryption, and usage logging are baseline requirements rather than optional extras. Version control matters just as much. A metric updated after distribution must be logged and flagged clearly. A stable, time stamped snapshot should be kept for every board cycle.
A number without context is easy to misread. A spike in attrition could mean layoffs, voluntary churn, or a planned exit strategy. Only a narrative owner close to that metric can explain which one applies here. Assigning that ownership to the functional leader behind each number keeps the story accurate. Leaving interpretation to whoever happens to present the deck rarely works as well. The same discipline extends to soft metrics such as diversity statistics or emissions data. Selective framing can quietly mislead even without any real intent to deceive.
Legal Review and Cross Functional Ownership
Interactive dashboards reaching the boardroom count as formal communication with fiduciaries. Forward looking statements and risk disclosures inside them need the same legal scrutiny as any board book. This matters most in dashboards carrying projections or competitive comparisons. Coordination matters too, since updates may now originate from multiple departments rather than one central team. A dashboard governance council, made up of senior leaders and data owners, keeps that coordination from drifting into version confusion.
Building for Sustainability, Not One Person
A dashboard should never depend on a single analyst or an outside consultant to stay alive. That kind of dependency turns a governance tool into a fragile one. The stronger path builds on scalable architecture, integrated with the company’s broader data fabric, and maintained by a durable internal team. Boards should never find themselves waiting on one person’s calendar for their most critical oversight data. Sustainability, in this sense, is itself a governance requirement rather than a technical preference.
Embedding Dashboards Into the Rhythm of Governance
Introducing an interactive dashboard is a behavioral shift, not just a technology upgrade. Marketing already tracks campaigns live. Finance already tracks cash daily. Boards, by contrast, have historically relied on packaged updates tied to a quarterly cycle. Building real board capabilities means closing that gap deliberately.
From Static Meetings to Living Systems
The shift below captures how that gap closes in practice.
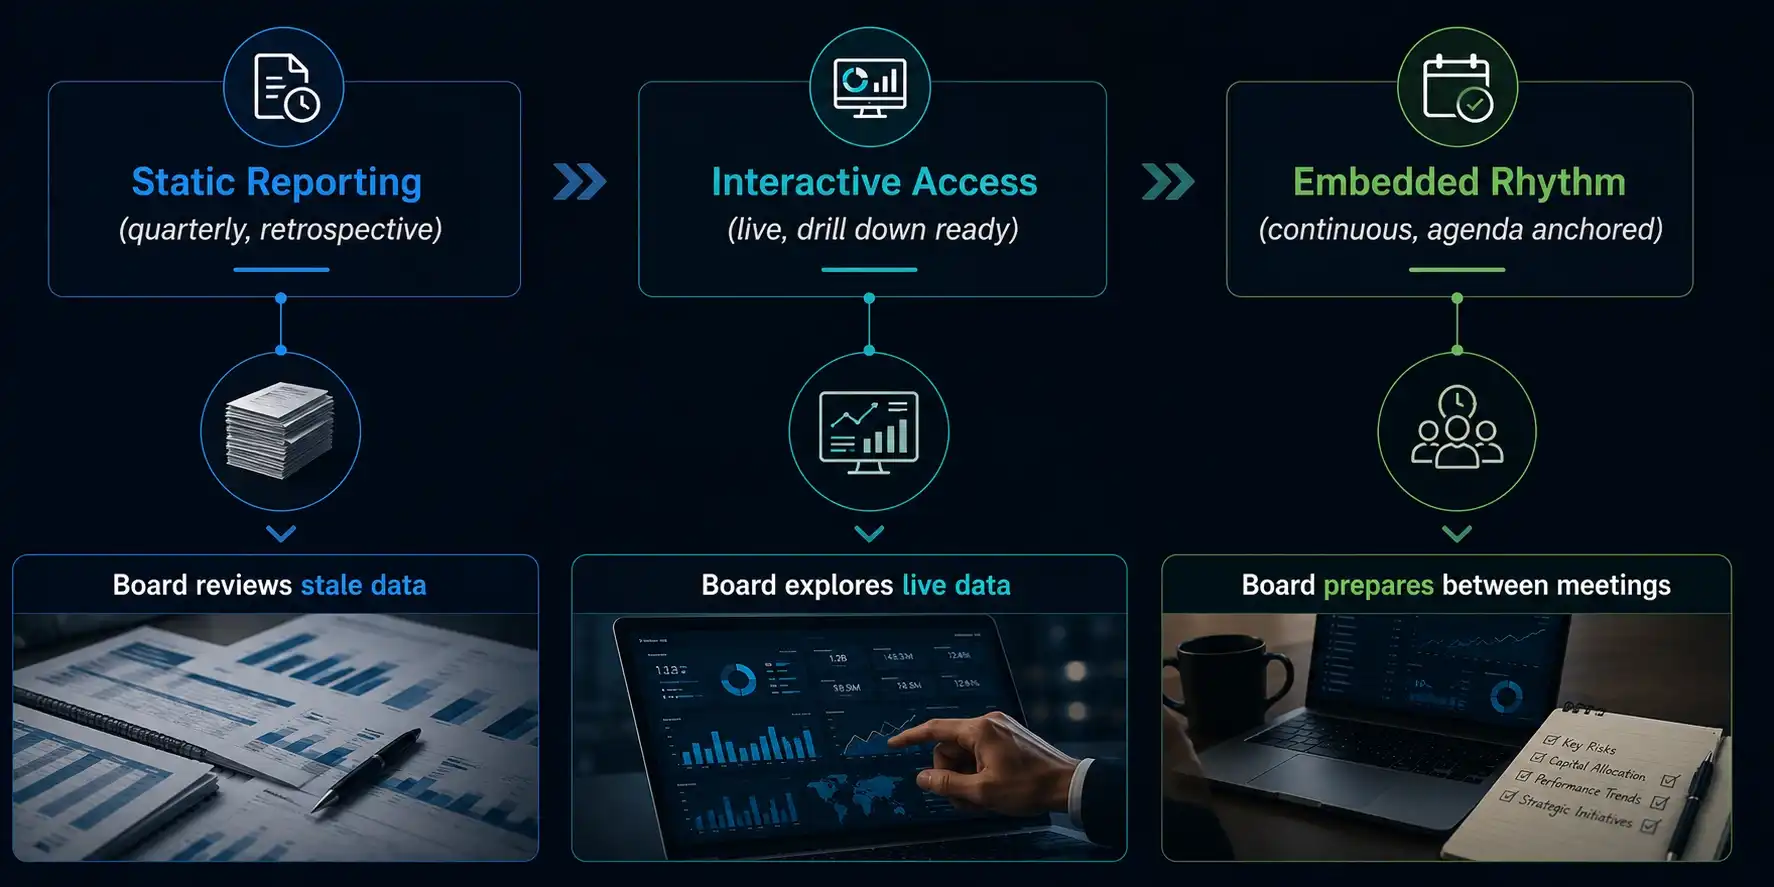
New directors should be onboarded into a company’s data vocabulary. The same care already goes into onboarding them on strategy and governance norms. Skipping this step tends to leave dashboards underused, since a tool nobody was trained to navigate rarely earns real trust. Once deployed, dashboards belong inside the agenda itself. A finance discussion should open with the live revenue dashboard. It should not open with a static slide followed by a passing reference to a tool nobody actually opens.
This pattern has repeated across sectors as different as cybersecurity, SaaS, and logistics, wherever audit and risk committees were the first to adopt real time financial tracking. The lesson each time was the same. Committees that trusted their data moved faster than committees that were still waiting for the next static update.
What Changes When Boards Trust Their Data
Committee work sharpens once dashboards are tailored to committee mandates. An audit committee can monitor controls in real time. A compensation committee can track incentive performance against target continuously, rather than once a quarter. A risk committee can watch a threat matrix update as new events emerge in the world outside.
A quieter shift matters just as much. Less meeting time goes toward simply agreeing on what happened. More time goes toward why it happened and what to do next. Directors arrive better prepared, having already explored a trend before the room even convenes. A brief list captures the practical gains organizations tend to report once this rhythm takes hold:
- Fewer surprises, since anomalies surface as they happen rather than at the next quarterly meeting
- Sharper questions, since directors spend less time clarifying data and more time interrogating strategy
- Smoother transitions, since new board members inherit a living system of record instead of a stack of old PDFs
None of this happens automatically. Executive leadership has to model the behavior first. Referencing the dashboard directly in discussion matters more than treating it as a side tool. The board chair has to protect time in the agenda for genuine exploration. Status updates alone will not build this habit on their own.
Data Latency and Institutional Continuity
Boards will always ask a simple question during volatile periods. How current is this number right now. Dashboards need to label their update frequency clearly, whether daily, weekly, or quarterly. This single habit prevents false precision during a product recall or a cybersecurity incident. Institutional continuity follows from the same discipline. When board membership changes, a living dashboard gives new directors a stable throughline. They inherit a system of record instead of a stack of disconnected files.
Conclusion
Board capabilities improve only when directors get better access, not simply more data. Static reporting keeps a board oriented toward the past. Interactive dashboards, built with clarity, context, and disciplined governance, let directors engage with what is actually happening now. Design matters, but design alone cannot carry the shift. Trust in the underlying data has to hold, alongside tiered access aligned to committee roles and disciplined version control. The final step is cultural rather than technical. Dashboards only strengthen board capabilities once they live inside the meeting rhythm itself, anchoring agendas instead of trailing behind them. Organizations that make this shift tend to see fewer surprises and sharper questions. They also tend to see smoother transitions as board membership changes over time. Those that treat dashboards as a cosmetic upgrade will keep operating a governance model built for a slower world. The companies that get this right will not just report performance more clearly. They will govern it with far greater confidence.
Disclaimer: This blog is intended for informational purposes only and does not constitute legal, tax, or accounting advice. You should consult your own tax advisor or counsel for advice tailored to your specific situation.
Hindol Datta is a seasoned finance executive with over 25 years of leadership experience across SaaS, cybersecurity, logistics, and digital marketing industries. He has served as CFO and VP of Finance in both public and private companies, leading $120M+ in fundraising and $150M+ in M&A transactions while driving predictive analytics and ERP transformations. Known for blending strategic foresight with operational discipline, he builds high-performing global finance organizations that enable scalable growth and data-driven decision-making.
AI-assisted insights, supplemented by 25 years of finance leadership experience.