
Executive Summary
Strategic alignment is not a philosophical construct. It is a quantified advantage that determines whether an enterprise compounds value or merely accumulates activity. Every business unit contributes to enterprise outcomes through three financial levers: return on invested capital, EBITDA margins, and free cash flow. Incentives either reinforce that contribution or quietly undermine it, rewarding local wins that dilute shareholder value. Cross-functional friction, often dismissed as a cultural inconvenience, carries a measurable financial cost in delayed revenue, bloated inventory, and inefficient working capital. Capital deployment reveals the truest version of a company’s strategy, regardless of what the strategy deck claims. When a CFO connects these four dimensions, financial contribution, incentive design, collaboration, and capital discipline, strategic alignment stops being a slogan and becomes an operating system for long-term value creation.
The Fabric of Value: How Business Units Serve Enterprise Objectives
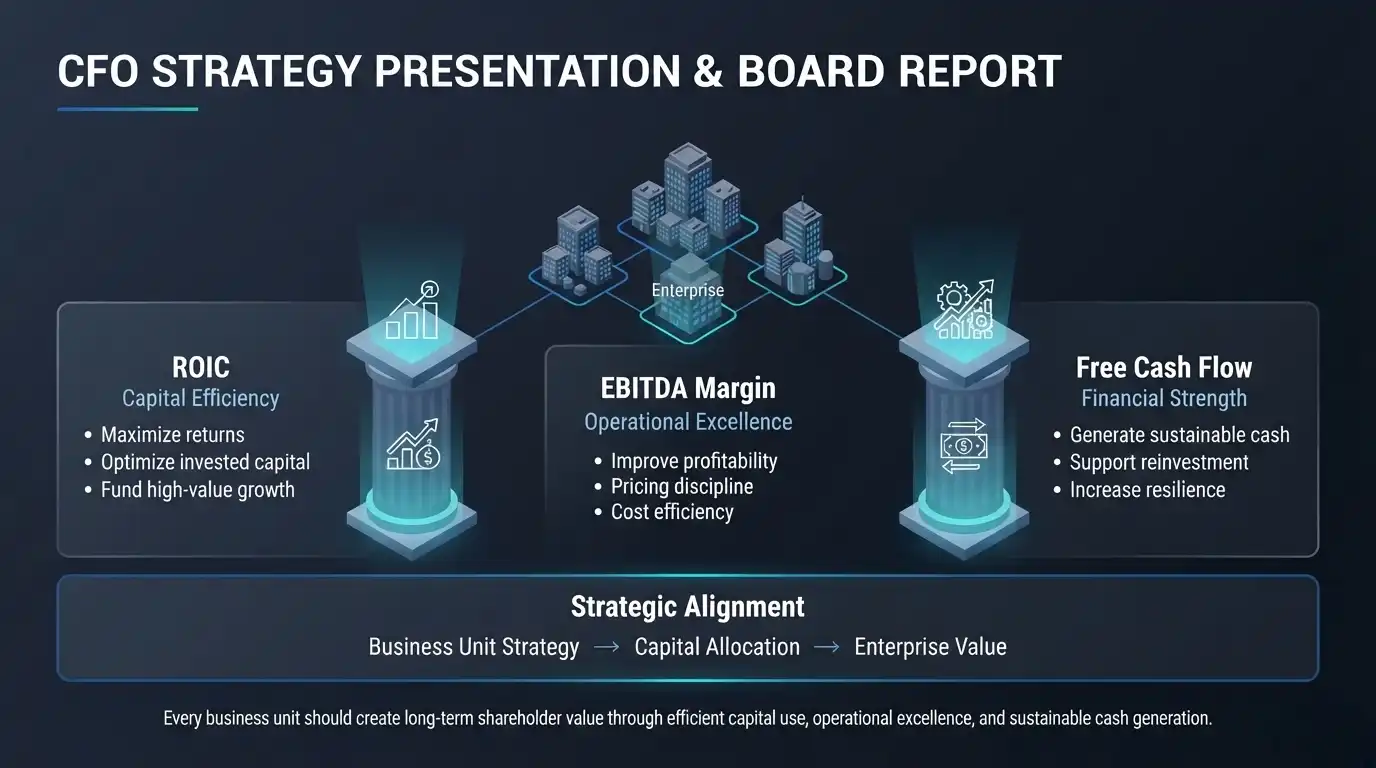
Each business unit inside a corporation behaves like a distinct thread in a larger fabric, woven together to form something coherent. The CFO’s role is not to admire the texture of any single thread but to ask a direct question: does this unit strengthen the cloth, or is it fraying the edges? In financial terms, that question becomes whether a unit’s strategy genuinely advances superior ROIC, sustainable EBITDA margins, and robust free cash flow. This is not a matter of operational tidiness. It is a matter of enterprise stewardship, ensuring that every strategic decision, whether made in a boardroom or on a shop floor, ultimately serves long-term shareholder value.
Return on Invested Capital: The Ultimate Scorekeeper
Return on invested capital, or ROIC, functions as the final arbiter of strategic success. It measures not just whether a business unit generates profit, but whether it does so with genuine economic efficiency. Over time, ROIC above the cost of capital separates wealth creators from capital consumers.
Evaluating a unit’s contribution to ROIC requires examining both the return and the capital behind it. A unit with strong revenue growth and solid margins can still depress enterprise ROIC if it consumes excessive capital through working capital inefficiencies or heavy fixed assets. A leaner, asset-light unit with modest growth but high returns can quietly outperform on this measure.
A CFO evaluating this should ask a consistent set of questions:
- Are returns improving year over year, and what is driving that improvement?
- Is the improvement coming from pricing power, cost discipline, or genuine innovation?
- How much capital does the unit tie up in receivables, inventories, or physical assets?
- Does the unit earn the right to further reinvestment, or should leadership harvest or restructure it?
When alignment genuinely exists, a business unit behaves like a steward of capital rather than a consumer of it, pursuing only profitable growth measured against a real hurdle rate.
EBITDA Margins: The Mirror of Operational Excellence
While ROIC captures capital productivity, EBITDA margins capture operational vigor. They reflect how efficiently a unit converts revenue into earnings before the effects of depreciation, amortization, interest, and taxes. Margins are not a non-GAAP distraction. They reveal the underlying muscle of a business, including cost control, pricing discipline, and scale efficiency.
A business unit strategy aligned with enterprise goals should target margin expansion through levers it directly controls, including streamlined cost structures, richer product mix, and better fixed cost leverage. It should resist the temptation of discount-driven volume growth in favor of delivering more value while charging appropriately and controlling cost.
Margin analysis still requires context. A CFO should distinguish between thinner margins reflecting a deliberate strategy to gain share in an emerging market and thinner margins reflecting weak execution. Temporary margin compression from R&D investment differs meaningfully from structural decline, and shared services can sometimes mask a unit’s true standalone performance. An aligned unit demonstrates not just ambition but credibility, showing a clear path to defend or grow margins against inflation, competition, and disruption.
Free Cash Flow: The Lifeblood of Strategy
If ROIC represents the score and EBITDA margins represent the engine, free cash flow is the fuel that keeps the enterprise moving. A unit can fail to convert accounting profit into actual cash. That unit looks appealing on paper but proves costly in substance.
Strategic alignment ultimately reduces to one practical question. Does this unit consistently generate cash that the enterprise can reinvest, return to shareholders, or redeploy elsewhere? Investment is entirely reasonable under three conditions. Payback periods must be clear. The internal rate of return must exceed hurdle rates. Working capital needs must be well understood. Alignment becomes a platitude, however, when a unit habitually consumes cash, misses forecasts, and blames external conditions.
To gain real clarity, a CFO needs full visibility into capex schedules, customer payment patterns, inventory turns, and vendor terms. Free cash flow is not a finance department curiosity. It funds growth, pays dividends, retires debt, and builds resilience across the enterprise.
Strategic Contribution as a Governance Imperative
Answering how each business unit contributes to enterprise financial objectives requires blending analytics with governance. Strategic alignment is not a static condition. It must be revalidated continuously through planning cycles, board reviews, and capital allocation decisions. This implies a cultural shift, where business unit leaders present strategy as a chapter in the enterprise’s broader value narrative rather than an isolated story, and where financial objectives are jointly owned rather than imposed from above.
Incentive Alignment: The Architecture of Enterprise Value
Incentives function as the quiet hands that move the pieces across an organization. They are rarely visible to customers or investors, yet they dictate the tempo and quality of execution throughout the enterprise. Whether business unit incentives connect meaningfully to enterprise-wide KPIs is not simply a compensation policy question. It is a matter of capital efficiency and long-term shareholder value.
What often masquerades as unit autonomy is, in practice, fragmentation. Unit leaders pursue top-line growth even as margins shrink. Product teams launch offerings that win awards but lose money. Sales incentives inflate volume at the expense of working capital. These outcomes are not moral failures. They are design flaws, and when incentives reward the wrong behaviors, they create arbitrage opportunities rather than genuine alignment.
The Problem of Local Optima
Local optimization resembles winning a battle while losing the war. A unit that exceeds its revenue target through deep discounting, inflated receivables, or overbuilt inventory has not created value. It has merely shifted cost and risk onto the enterprise ledger. Misalignment tends to appear in three recognizable patterns:
- Siloed metrics that measure revenue or unit growth without regard to gross margin, ROIC, or cash conversion
- Short-termism, where annual incentives ignore long-term value creation or strategic transformation
- Asymmetrical risk and reward, giving unit heads upside without equivalent downside for value destruction
The consequence is behavior that flatters a single unit while leaving the broader enterprise financially exposed, a familiar agency problem where incentives diverge from shareholder interest.
Enterprise KPIs as the Common Currency
The remedy for misalignment is clarity. Enterprise-wide KPIs should function as a common currency across every unit, much like a single mission objective that unites every soldier in a battalion regardless of rank. Common enterprise KPIs typically include a few core measures. These are ROIC relative to cost of capital, EBITDA margin expansion, and free cash flow conversion. Others include customer retention or Net Promoter Score, along with strategic milestone completion such as digital adoption or ESG targets. When units are rewarded for contributing to these enterprise metrics rather than isolated unit-specific numbers, behavior shifts meaningfully. A marketing leader begins considering CAC relative to LTV. A sales manager focuses on profitable revenue rather than raw volume. A product leader resists feature bloat in favor of measurable return.
Designing Incentives That Scale Intelligently
Incentive design must be systemic enough to scale without collapsing into either a rigid one-size-fits-all model or an unmanaged decentralization that invites entropy. A nested structure tends to work well across most enterprises, balancing enterprise, business unit, and individual layers of variable compensation.
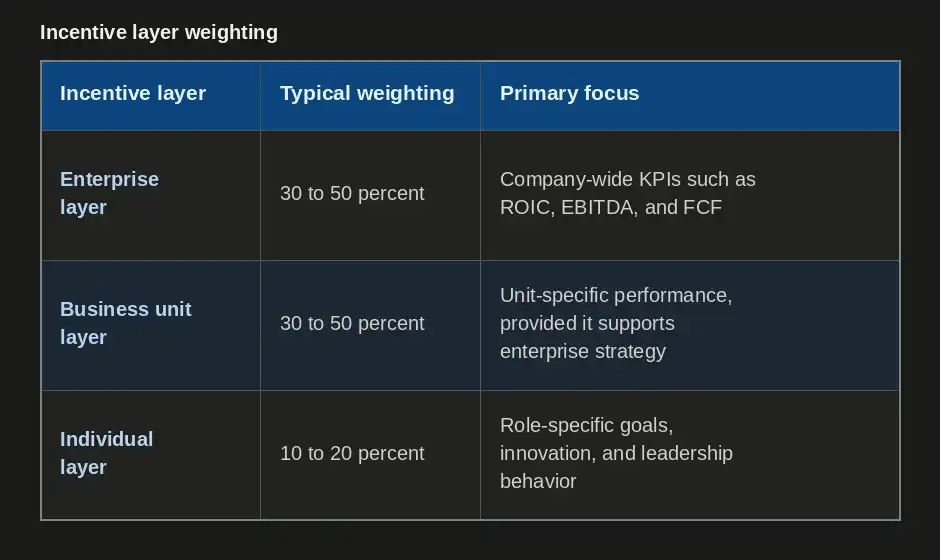
The time horizon behind these incentives matters as much as the weighting. Short-term gains should be balanced with long-term instruments such as equity grants, deferred bonuses, or performance-based stock units tied to three to five year outcomes. This structure reduces quarterly myopia and encourages genuine strategic patience.
Transparency, Trust, and Calibration
No incentive system functions well in isolation. For alignment to persist, units need transparency. They must see how their actions influence enterprise outcomes. They must understand how incentive formulas translate into actual payouts. KPIs also require regular calibration, since what works during a growth phase may fail during a downturn. HR, Finance, and Strategy functions should co-create incentive structures rather than build them in isolation. A CFO should treat a rising bonus pool alongside falling ROIC or negative free cash flow as a clear signal of incentive leakage. That is a strategic governance issue, not a purely administrative one.
The Cost of Friction: Quantifying Cross-Functional Misalignment
A perfectly aligned enterprise would resemble a symphony, with different instruments playing distinct parts that harmonize toward a shared outcome. Most organizations instead resemble a jazz band without enough rhythm, filled with solos and players who are not quite reading from the same sheet music. From a CFO’s perspective, friction between business units is not merely a cultural inconvenience. It is a measurable financial liability that slows revenue, inflates costs, and erodes return on invested capital.
Where Friction Grinds the Gears
Friction tends to concentrate in three recognizable zones:
- Process friction, including delayed handoffs between teams, inconsistent standard operating procedures, and informal workarounds that bypass normal workflow
- Information friction, where data fails to flow freely, leaving finance with late forecasts or procurement making decisions without visibility into engineering timelines
- Cultural or incentive friction, where product teams optimize for innovation while finance focuses on cost control, or sales pushes customization while operations demands standardization
Measuring the Financial Cost
Friction feels qualitative, but its consequences translate directly into dollars. A four week delay in launching a product due to miscoordination between product and regulatory teams can defer millions in forecasted revenue, and discounting that delay at a reasonable cost of capital reveals a genuine loss in present value. Misaligned demand forecasting between sales and supply chain functions creates excess inventory that erodes value through markdown risk. Friction inside the quote-to-cash process extends days sales outstanding, tying up meaningful working capital for a large business operating on net payment terms. Lack of coordination across IT or marketing functions creates duplicative software licenses and agency fees that quietly accumulate. High-performing talent often leaves not for compensation reasons but out of frustration with poor collaboration, and replacing a senior role can cost well beyond a year of salary once recruitment and ramp-up are considered.
Addressing Friction Through Financial Leadership
Cross-functional friction stems from a failure of design rather than a failure of intent. Most employees genuinely want to perform well, but the surrounding system works against them. Finance is well positioned to lead this diagnosis, since it holds both the vantage point and the analytical toolkit to expose the value leak. Effective interventions include integrating cross-functional KPIs such as order-to-cash cycle time or forecast accuracy, mapping zero-based accountability across critical workflows to remove ambiguous ownership, quantifying a “friction tax” using internal financial models, and funding integration efforts, such as ERP modernization or cross-functional teams, as a genuine capital investment rather than overhead.
Capital as Strategy: Aligning Deployment with Long-Term Value
Capital behaves like a scarce and irreplaceable mandate. Every dollar deployed carries an opportunity cost that cannot be recovered, and for a CFO, the truest test of strategic alignment lives not in a slogan or a quarterly deck but in the ledger itself. The central question, how much capital is flowing toward the future rather than the past, is thoroughly financial and demands an answer grounded in data and discipline.
Segmenting the Strategic Ledger
Assessing this requires segmenting capital deployment into distinct categories:
- Strategic priorities, including growth capex, innovation-driven R&D, adjacent acquisitions, digital capability building, and ESG-aligned investment, typically carrying long payback periods but essential future relevance
- Sustaining or legacy spend, including maintenance capex, compliance upgrades, and cash required to service structurally declining businesses
- Discretionary or neutral spend, such as office renovations or internal systems upgrades that may not clearly fall into either category
A CFO should quantify these buckets annually and track their trend across a rolling three to five year horizon.
When the Story and the Spend Diverge
A company’s narrative and its actual spending often diverge in ways that undermine investor trust. A strategy deck might extol a pivot toward digital ecosystems while the majority of R&D still funds legacy hardware refreshes. Leadership might discuss decarbonization goals while a small fraction of capex supports genuinely clean technologies. A robust capital alignment analysis should answer direct questions: what percentage of annual capex targets growth initiatives, how much R&D spend targets future-facing innovation versus sustaining legacy platforms, and what percentage of recent acquisition spend genuinely aligned with the company’s five year strategic objectives. When less than a third of capital flows toward the future while the majority remains absorbed by the past, an enterprise is preserving itself rather than compounding value, a slow form of decline in a dynamic economy.
The CFO’s Capital Deployment Scorecard
To institutionalize this discipline, a CFO can build a capital deployment scorecard tracking the share of capex directed toward strategic growth assets, the share of R&D directed toward next generation offerings, payback period and internal rate of return by project category, and capital allocated toward ESG, digital, and AI investment relative to public commitments. Reviewing this scorecard quarterly and presenting it to the board with clear commentary keeps capital allocation honest, since drift toward excessive sustaining spend and insufficient forward investment is a fiduciary issue rather than an optional area for course correction.
A Strategic Alignment Framework for the Enterprise
Bringing financial contribution, incentive design, cross-functional collaboration, and capital discipline together produces a coherent strategic alignment framework rather than four disconnected initiatives. Each layer reinforces the next, and the flow between them determines whether alignment translates into compounding value.
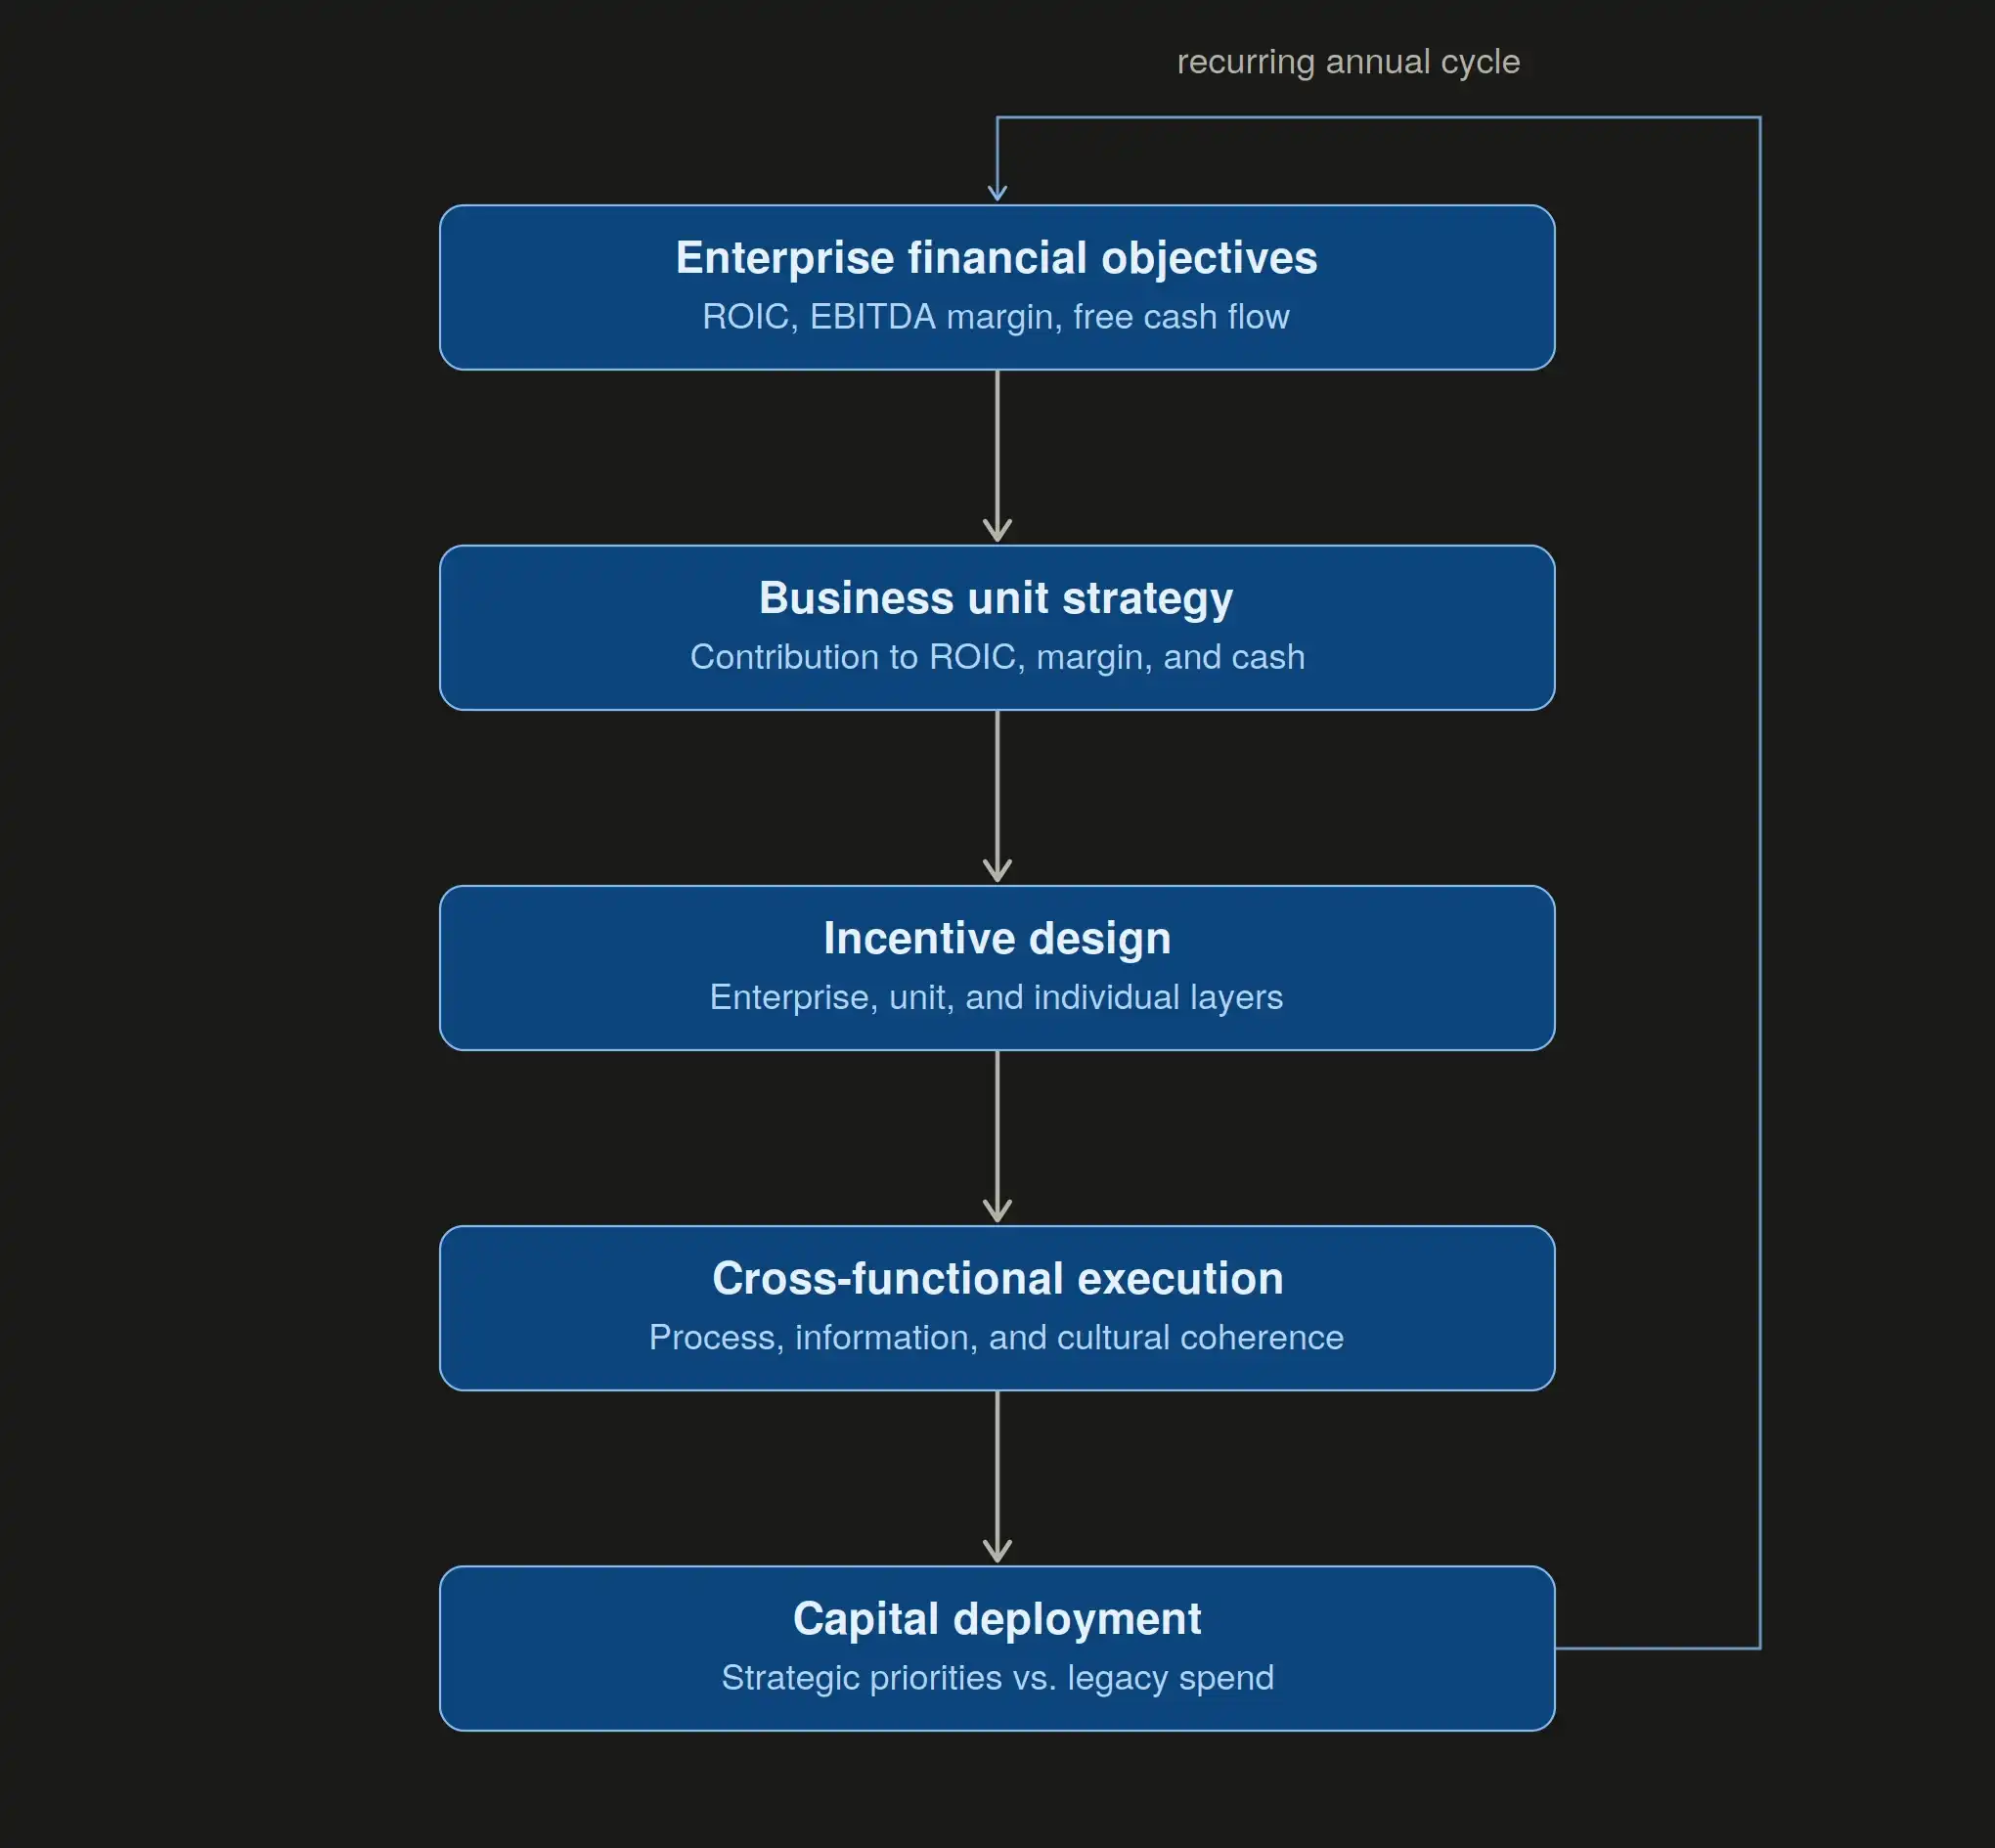
When every layer of this framework reinforces the one above it, an enterprise stops behaving like a collection of independent units and starts behaving like a genuine value engine. Boards should expect not just financial summaries but strategic contribution maps linking each unit to ROIC movement, margin trends, and free cash flow, since aligning strategy in this structured way keeps the entire organization rowing in the same direction.
Conclusion
Strategic alignment is ultimately a quantified advantage rather than an abstract aspiration. It requires a CFO to trace a single thread from enterprise financial objectives through business unit contribution, incentive design, cross-functional execution, and capital deployment. Each business unit earns its place in the enterprise not through the eloquence of its strategy deck but through its measurable contribution to ROIC, EBITDA margin, and free cash flow. Incentives either reinforce that contribution or quietly erode it through local optimization. Friction between functions, left unmeasured, becomes an invisible tax on growth and working capital. Capital allocation, more than any statement of intent, reveals whether an enterprise is genuinely investing in its future or merely maintaining its past. When these dimensions operate as a single coherent system rather than isolated initiatives, the enterprise stops being a sum of its parts. It becomes a multiplier, and that, in the end, is what a durable strategic alignment framework is meant to deliver.
Disclaimer: This blog is intended for informational purposes only and does not constitute legal, tax, or accounting advice. You should consult your own tax advisor or counsel for advice tailored to your specific situation.
Hindol Datta is a seasoned finance executive with over 25 years of leadership experience across SaaS, cybersecurity, logistics, and digital marketing industries. He has served as CFO and VP of Finance in both public and private companies, leading $120M+ in fundraising and $150M+ in M&A transactions while driving predictive analytics and ERP transformations. Known for blending strategic foresight with operational discipline, he builds high-performing global finance organizations that enable scalable growth and data-driven decision-making.
AI-assisted insights, supplemented by 25 years of finance leadership experience.