Executive Summary
Organizational design often functions as an art form. Executives sketch it on a whiteboard and adjust it by instinct whenever growth demands it. Workforce forecasting replaces that instinct with evidence. Layer revenue projections against hiring lead times, onboarding capacity, and span-of-control assumptions. The organizational chart stops being a static diagram. It becomes a model that can be stress-tested before the business commits real capital to it.
This article examines five dimensions of that discipline. It looks at how workforce forecasting shapes organizational design. It also shows where forecasting uncovers hidden inefficiency and how it balances agility with structure. Beyond that, it covers how forecasting supports talent and succession planning. It also explains why data quality and culture determine whether any of it can be trusted.
Workforce Forecasting as an Organizational Design Tool
Growth is rarely symmetric. Revenue can double while onboarding capacity, legal review, and regional compliance lag well behind. A structure built for one stage of the business quietly becomes unfit for the next. Workforce forecasting catches that mismatch early. It translates a revenue curve into headcount, reporting lines, and geographic footprint. This happens before the strain shows up in missed deadlines or overworked managers.
In a high-growth cybersecurity and identity access management company scaling toward $30M in annual recurring revenue across five countries, a driver-based forecasting engine and capacity model built from the ground up held actual results within 5% of forecast for 8 consecutive quarters. That consistency did more than satisfy the board; it gave leadership the confidence to make structural decisions, such as when to add a regional finance lead or when a function could remain centralized, well ahead of the pressure point rather than in reaction to it.
Forecasting of this kind typically surfaces three structural signals:
- Capacity thresholds – points at which onboarding, support, or delivery teams cannot absorb projected volume without adding headcount or automation
- Span-of-control breaks – moments where a manager’s team has outgrown what one person can reasonably lead
- Geographic inflection points – when customer concentration in a new region justifies a local entity, hire, or reporting structure
Using Forecasting Models to Diagnose Organizational Inefficiency
A forecast built only on top-line revenue growth tells a limited story. Once departmental headcount, resource utilization, and delay costs are added to the model, the picture sharpens considerably, and inefficiencies that hide behind familiarity or legacy process start to surface.
At a $127M global consumer products company operating across DTC, Amazon, and wholesale channels with a supply chain spanning China and Vietnam, forecasting tied to demand planning and SKU rationalization helped more than double inventory turns from 3x to 7x. The gain was not simply a working-capital win; it exposed how much organizational effort had been absorbed managing slow-moving inventory that better forecasting discipline made unnecessary. Four consecutive clean external audits followed, a byproduct of a finance organization that finally had visibility into where effort was being spent.
Common inefficiency signals a forecasting model can expose include:
- Rising SG&A without a corresponding increase in revenue or output
- Onboarding or support teams growing slower than customer acquisition
- Duplicated functions across business units performing overlapping work
- Manual approval steps that quietly extend cycle times across multiple departments
Balancing Agility with Structure
Structure provides governance; agility provides responsiveness. Workforce forecasting earns its place as a design tool precisely because it lets an organization test both without committing to either prematurely, simulating what happens if a team scales by 20%, a product launches early, or a new region opens, and revealing whether the current structure can absorb that change or will need to bend first.
At a mission-driven education and research institution operating with a lean executive team, forecasting had to accommodate a very different tempo. Finance and audit committee reporting demanded rigid cadence, while development and fundraising needed to move flexibly around variable philanthropic and earned-revenue conditions. A single, uniform forecasting model would have suffocated one function or destabilized the other. Multi-year financial modeling built to account for that variability, alongside a $37M capital raise across equity and venture debt, made room for both tempos inside one coherent plan.
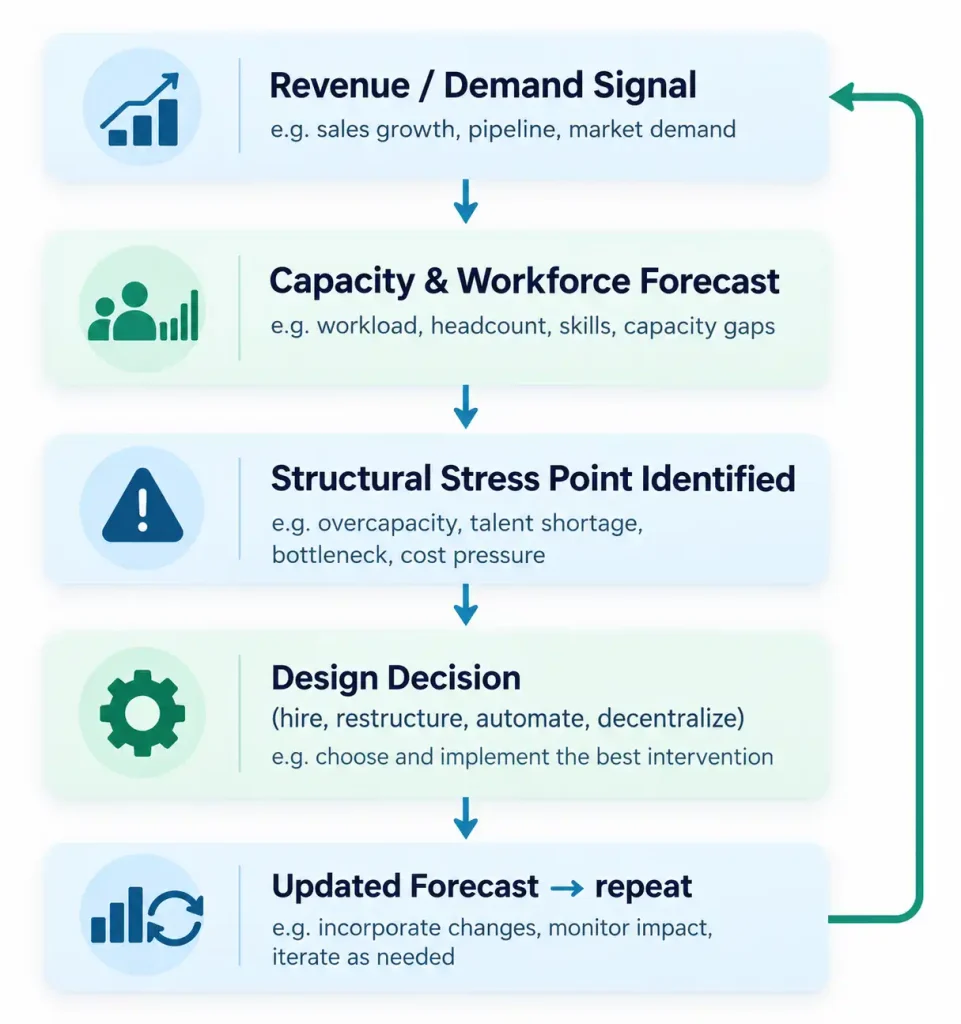
The loop connecting forecast to design typically runs as follows:
Forecasting Talent: Workforce Planning for Succession and Scale
Capital is easier to forecast than people. Talent readiness does not follow a quarterly cadence, and a workforce forecast that accounts only for headcount, without accounting for timing, misses the deeper planning question of when a leader will be ready to carry more responsibility.
At a venture-backed performance marketing company that scaled from $9M to $180M in revenue over 24 months, the finance function grew from a single person to a team of twelve while three acquisitions were integrated along the way. That kind of growth curve makes succession planning inseparable from workforce forecasting: without mapping which roles would need a second or third layer of leadership, the finance organization would have hit a ceiling well before the revenue did.
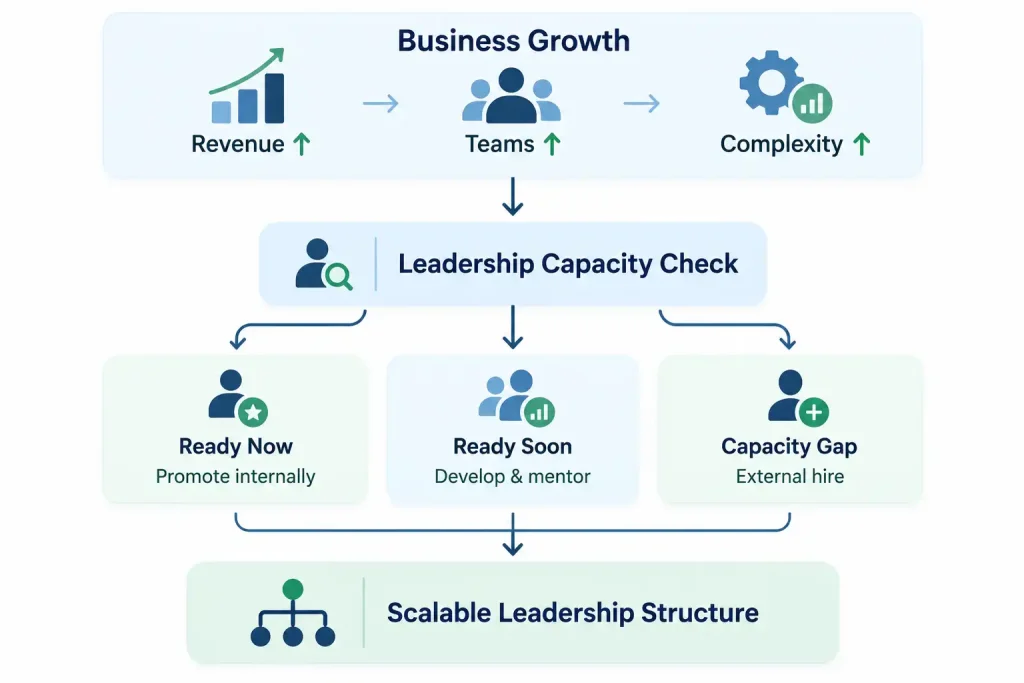
Workforce forecasting supports succession planning through:
- Attrition and compensation-inflation assumptions layered into multi-year headcount plans
- Readiness indicators that flag which leaders are prepared to scale with the business
- Bench-strength mapping that identifies single points of failure in critical departments
- Lead-time modeling for external hires versus internal promotion
Data Quality and Culture: The Hidden Risk in Every Forecast
The most sophisticated forecasting model is only as reliable as the assumptions feeding it, and assumptions are shaped by incentives as much as by data. Sales teams inflate pipeline to protect headcount; marketing overstates lead quality to defend budget. None of this is necessarily dishonest, but it compounds over time into a forecast built on optimism rather than evidence.
A Euronext Paris-listed public gaming and digital entertainment company operating across five countries confronted a version of this problem at scale: five subsidiaries, five sets of assumptions about what “revenue” meant. Rolling out a single financial reporting system firmwide created one unified definition of revenue and materially compressed statutory reporting cycles under both IFRS and US GAAP. The technical fix mattered less than what it enabled: a forecast every region trusted, because every region had contributed to and could see the same numbers.
Practices that protect forecasting integrity include:
- Requiring teams to attach confidence intervals, not just point estimates, to their inputs
- Building assumption libraries that document and expose the logic behind every forecast line
- Standardizing metric definitions across HR, finance, and operations before consolidating data
- Treating forecast revisions as evidence of learning rather than a sign of failure
Three Key Takeaways
- Workforce forecasting works best when treated as a design instrument rather than a reporting exercise, translating revenue and demand assumptions into concrete signals about headcount, span of control, and geographic structure before those pressures become visible in day-to-day operations.
- The value of a forecasting model depends less on its sophistication than on the honesty of its inputs, which means organizational design decisions are only as sound as the assumption-vetting culture that produced the numbers behind them.
- Talent and succession planning belong inside the same forecasting discipline as headcount and cost, since a structure that can afford new roles on paper still fails if no one is ready to lead them when the moment arrives.
Disclaimer: This article is intended for informational purposes only and does not constitute legal, tax, or accounting advice. You should consult your own tax advisor or counsel for advice tailored to your specific situation.
Hindol Datta is a four-time CFO and senior finance executive with over 25 years of leadership experience across cybersecurity, SaaS, gaming, logistics, digital marketing, medical devices, consumer products, and nonprofit organizations. He has led more than $120M in fundraising and over $150M in M&A transactions while building the financial and operational systems that let complex businesses scale with confidence. He is the author of seven books in the Systems CFO Series and holds active CPA, CMA, and CIA credentials.
AI-assisted insights, supplemented by 25 years of finance leadership experience.