
Executive Summary
What is ARR in finance, and why does it matter so much to subscription businesses? Annual recurring revenue measures the yearly value of contracted, repeating revenue, and it gives leaders a steady signal in an otherwise volatile market. Yet a rising ARR line can hide churn, weak pricing, and costs that grow faster than scale. Recurring revenue offers predictability, not a guarantee of profit.
The sections ahead explain ARR and how CFOs turn it into sustainable margin. They cover unit economics beneath the headline number, pricing as a strategic lever, and the cost traps that come with scale. They also address dynamic forecasting and the culture that keeps profit discipline alive. Together they show that a recurring model must earn its profit again with every renewal.
What Is ARR in Finance and How Is It Measured?
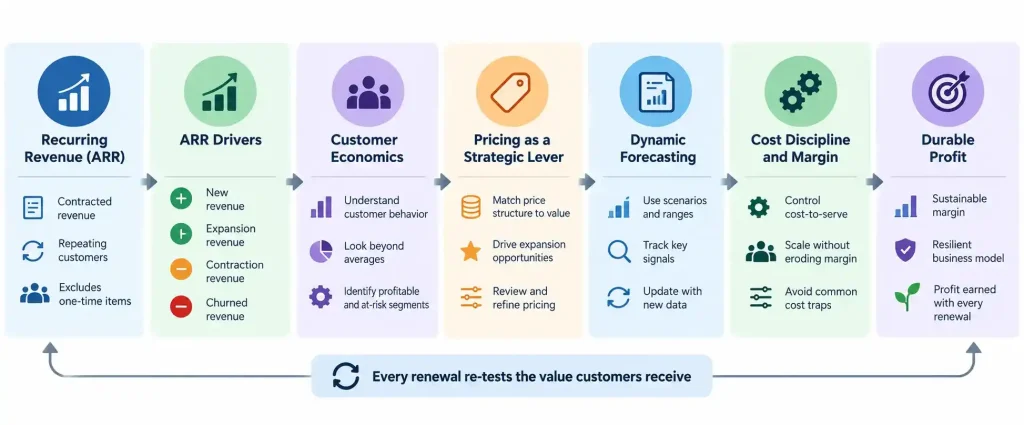
Annual recurring revenue, or ARR, is the annualized value of recurring subscription or contract revenue that a company expects to continue. Most companies calculate it by multiplying monthly recurring revenue by twelve or by summing the annual value of active contracts. ARR usually excludes one-time items such as setup fees, hardware sales, and non-recurring services.
The ARR Bridge
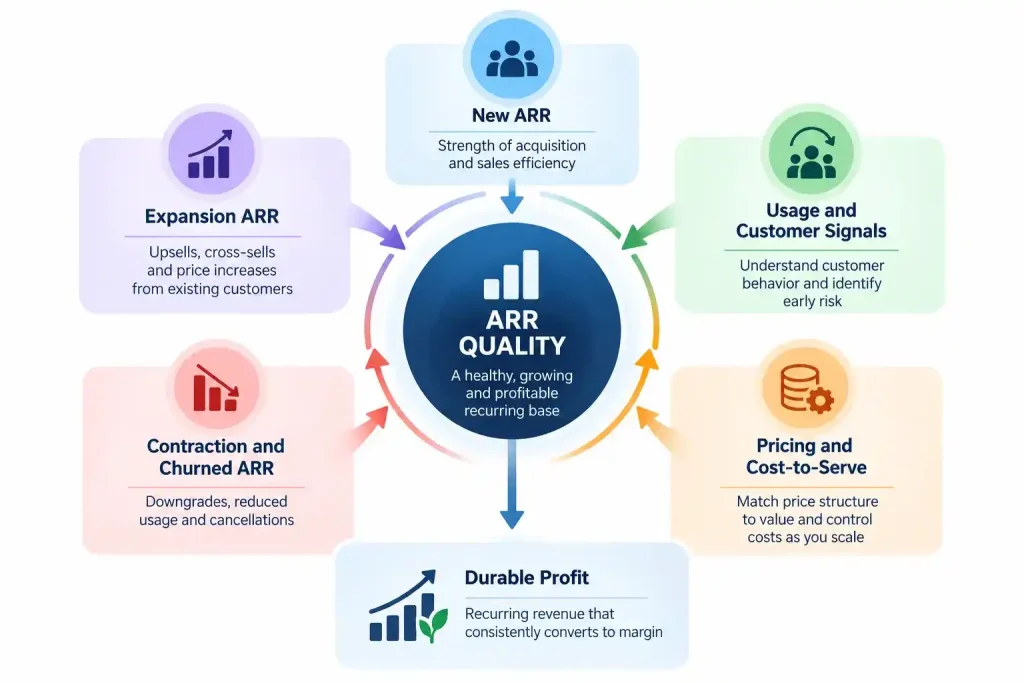
A single ARR figure says little on its own. Finance teams gain far more insight by breaking the change in ARR into its moving parts, often called an ARR bridge.
Components of an ARR Bridge
| Component | What It Measures | What It Reveals |
| Starting ARR | Recurring revenue at the beginning of the period | The base the business must protect |
| New ARR | Revenue from newly acquired customers | Strength of acquisition and sales efficiency |
| Expansion ARR | Upsells, cross-sells, and price increases | Value customers find as they grow |
| Contraction ARR | Downgrades and reduced usage | Early signs of fading value |
| Churned ARR | Revenue lost from cancellations | Gaps between promise and experience |
| Ending ARR | Net result after all movements | Overall health of the recurring base |
The bridge shows why ARR growth alone can mislead. Strong expansion can disguise flat new sales, and low headline churn can mask decay in a valuable segment. Each renewal acts as a re-election in which customers vote again on the value they receive.
Unit Economics Beneath the ARR Line
Any honest answer to what is ARR in finance must look beneath the headline figure. Recurring revenue turns every customer into a small income statement with its own lifecycle, margin, retention risk, and cost to serve. Company-wide averages tend to hide those important differences. One cohort can look healthy on a revenue curve while containing customers with sharply different retention patterns and support costs.
Mapping Customer Behavior
The CFO should segment customers by economic behavior, not only by size or industry. Some customers expand quickly and then contract just as fast. Others plateau, neither growing nor leaving, while quietly weighing on margin. Some grow fast but consume heavy support, and others stay loyal and profitable with little attention.
Metrics such as CAC, LTV, and payback period remain useful, but they assume stable and independent behavior. A stronger approach treats variance as a signal, tracks tail risk as well as medians, and updates estimates as new customer data arrives. Churn interviews and usage data can then explain why customers leave, not just how many.
A marketplace SaaS company with operations in the United States and Poland shows the value of this discipline. Cohort and unit economics models, along with consolidated cross-border reporting, anchored investor diligence during a $20M Series B. Investors could see how each customer group contributed to recurring revenue.
Pricing as a Strategic Lever for ARR
Pricing is where product value, customer behavior, and market positioning compress into a single number. In many companies, however, pricing comes from past launches, competitor benchmarks, or fear of change. An annual ARPU target shows what the company earned, not what it could have earned.
Matching Price Structure to Value
Every pricing model reflects a theory of value. The right structure mirrors how customers actually gain value from the product.
Common Recurring Pricing Models
| Pricing Model | Unit of Value | Best Fit | Main Risk |
| Per-user | Individual seats | Tools used by named individuals | Underpricing heavy or high-value usage |
| Usage-based | Volume or activity | Infrastructure and variable workloads | Revenue volatility and forecasting difficulty |
| Tiered | Feature or service bundles | Products serving diverse segments | Poorly defined tiers that confuse buyers |
| Flat-rate | Single subscription | Simple products with uniform use | Leaving money on the table with large customers |
The CFO can bring product, marketing, and data teams together around value-based segmentation. Useful questions include which jobs customers hire the product to do, where marginal value concentrates, and which usage signals predict expansion. A small pilot with better-matched tiers may reveal that a segment once viewed as price sensitive will move upward quickly.
A cybersecurity SaaS company with roughly $30M in ARR shows how pricing discipline affects margin. Gross margin improved by twelve percent through pricing discipline, workforce composition, and delivery cost management. Those gains strengthened the quality of the company’s recurring revenue, not just its size.
Cost Architecture and the Traps of Scale
Profit comes from the structure of cost as much as from revenue. Many growth companies assume that scale will spread fixed costs and expand margins automatically. In practice, scale multiplies both efficiency and dysfunction.
Why Margins Plateau
Support tickets often rise with the number of integrations and edge cases, not only with the number of users. Onboarding spreads into adjacent teams, and internal coordination needs more tools and meetings. What appears as customer success or R&D spend may partly reflect organizational friction.
The CFO should practice marginal cost honesty across every customer segment. Serving one customer may cost little, while serving another may quietly turn that account unprofitable. Several habits help protect margin as ARR grows:
- Review true acquisition cost by cohort instead of company-wide averages
- Map service load and support intensity by customer segment
- Model gross margin forward as well as backward
- Track coordination costs such as decision delays and repeated meetings
- Question legacy spending patterns that no longer serve the current strategy
In a recurring model, every point of margin lost repeats each year instead of appearing once. Growth does not forgive bloated cost structures; it amplifies them.
Dynamic Forecasting for Recurring Revenue
The contractual rhythm of recurring revenue can create a false sense of stability. Many forecasts simply extend known bookings, extrapolate churn, and grow spending at a steady rate. These forecasts assume static customer behavior in a system that keeps changing.
Ranges, Signals, and Ownership
A stronger forecast states ranges and conditions instead of a single figure. A weaker forecast might claim that ARR will reach $58M next year. The stronger version states 80% confidence that ARR will land between $55M and $61M. That estimate assumes churn stays below 5% and expansion holds its current pace.
Dynamic models also respond to signals such as login patterns, billing events, support tickets, and feature adoption. Product owns the usage curve, sales owns bookings probability, and customer success owns expansion logic. The CFO unifies those pieces into one coherent model. The key question shifts from whether the forecast was right to how quickly the team learned it was wrong.
A venture-backed digital marketing company that grew from $9M to $180M in revenue within 24 months illustrates the value of fast, data-driven planning. Rigorous CAC, LTV, and contribution margin analysis guided spending during rapid growth. Strong unit economics kept growth tied to measurable returns.
Building a Culture of Profit Discipline
In many companies, technical sophistication outruns cultural depth. Dashboards may look refined and forecasts may arrive on time, yet teams may still treat profit as finance’s concern. Recurring models need optimization that runs continuously through daily decisions.
Shared Language for Trade-Offs
Not every employee needs to know the margin profile of each segment. Product managers, however, should understand the cost of feature bloat, and salespeople should know which customers are likely to renew. Support teams can see empathy as a defense of margin, not just a soft skill.
Finance becomes the economic conscience of the company by asking steady questions. Does this move the business toward durable value? Can the company keep the value it creates? When teams speak the language of consequence, profit stops needing enforcement and becomes a natural result of aligned decisions.
Answering the question of what is ARR in finance is only the starting point. The real work lies in reading what drives it, protecting its margin, and earning each renewal again. Companies that do this well build recurring revenue that compounds into lasting profit.
Three Key Takeaways
- ARR measures the annualized value of recurring revenue, and an ARR bridge reveals the new, expansion, contraction, and churn movements behind the headline figure.
- Segment-level unit economics, value-based pricing, and honest marginal cost analysis turn recurring revenue into sustainable margin.
- Range-based forecasts, cross-functional ownership, and a shared language of trade-offs keep profit discipline alive as annual recurring revenue grows.
Disclaimer: This article is intended for informational purposes only and does not constitute legal, tax, or accounting advice. You should consult your own tax advisor or counsel for advice tailored to your specific situation.
Hindol Datta is a four-time CFO and senior finance executive with over 25 years of leadership experience across cybersecurity, SaaS, gaming, logistics, digital marketing, medical devices, consumer products, and nonprofit organizations. He has led more than $120M in fundraising and over $150M in M&A transactions while building the financial and operational systems that let complex businesses scale with confidence. He is the author of seven books in the Systems CFO Series and holds active CPA, CMA, and CIA credentials.
AI-assisted insights, supplemented by 25 years of finance leadership experience.