
Executive Summary
Subscription profitability analysis is the discipline that tells a SaaS company whether its recurring revenue is actually recurring profit. ARR can look healthy while deferred revenue schedules smooth over real weakness underneath. A board chasing growth at any cost rarely notices until margin has already eroded.
This article sets out a practical approach to subscription profitability analysis. It covers why CAC and LTV alone miss the real picture. The analysis also traces how fixed and variable costs actually behave at scale. And it treats churn as an economic variable, not a static KPI. And it covers how to design profitability into a company’s habits, rather than just reporting it after the fact.
Beyond CAC and LTV: What Subscription Profitability Analysis Actually Requires
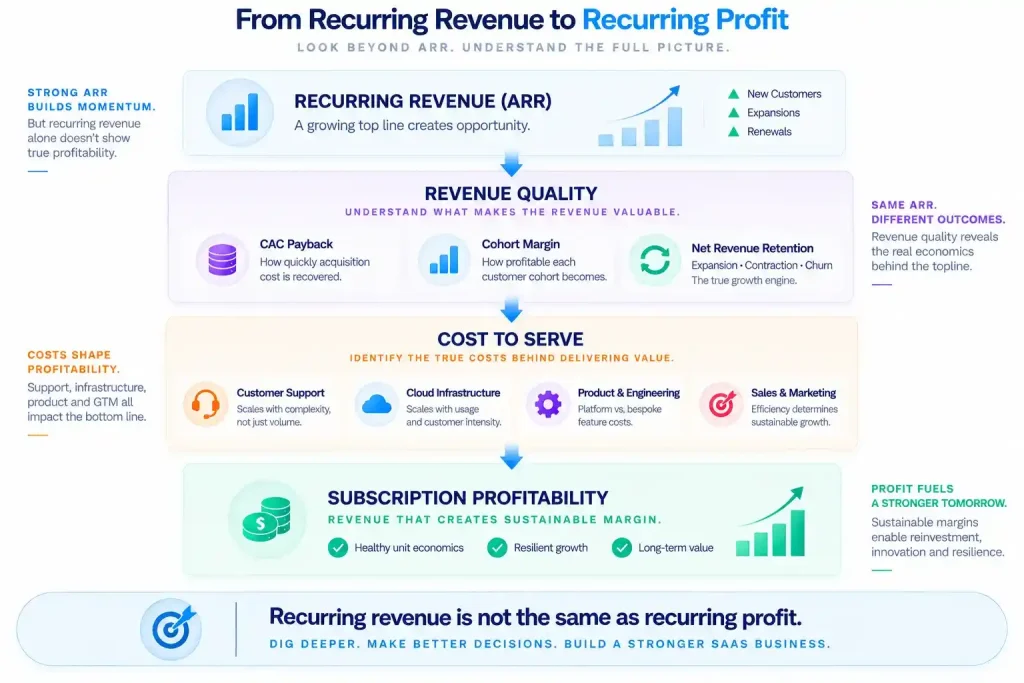
The LTV to CAC ratio works well enough for an early-stage pitch deck. It says little about the quality of revenue, the shape of churn, or how long a customer actually stays. A mature profitability analysis for a SaaS company needs three additional layers.
- CAC payback period: months until gross margin covers acquisition cost, ideally under 18 months in enterprise SaaS
- Gross margin by acquisition cohort, since a cohort acquired two years ago often behaves nothing like one acquired last quarter
- Net revenue retention, broken into cross-sell, upsell, downsell, and churn, since a blended number can hide a real churn problem
Fixed vs. Variable Costs: The Myth of Scale in SaaS
Many subscription businesses assume fixed costs will simply dissolve into margin once the subscriber base grows large enough. That assumption only holds partway.
Four cost categories deserve their own scrutiny rather than a single blended view.
- Customer support costs, which can rise with complexity even when they should fall with volume, especially without strong self-service tools
- Cloud infrastructure, which scales with usage rather than headcount, so a few high-intensity customers can compress margin as revenue grows
- Product and engineering spend, often skewed toward bespoke enterprise features rather than scalable platform work
- Sales and marketing efficiency: a rising CAC under competition looks very different from a falling CAC as brand awareness matures
Segmenting these costs by customer type, not just by function, often reveals that a customer segment looks profitable on revenue alone and destroys unit economics once onboarding and support get priced in.
Churn as an Economic Variable, Not Just a Metric
Churn gets reported quarterly and rarely diagnosed with any precision. Treated as a static number, it hides more than it reveals. Treated as an economic variable, it shapes the actual cash yield of every cohort.
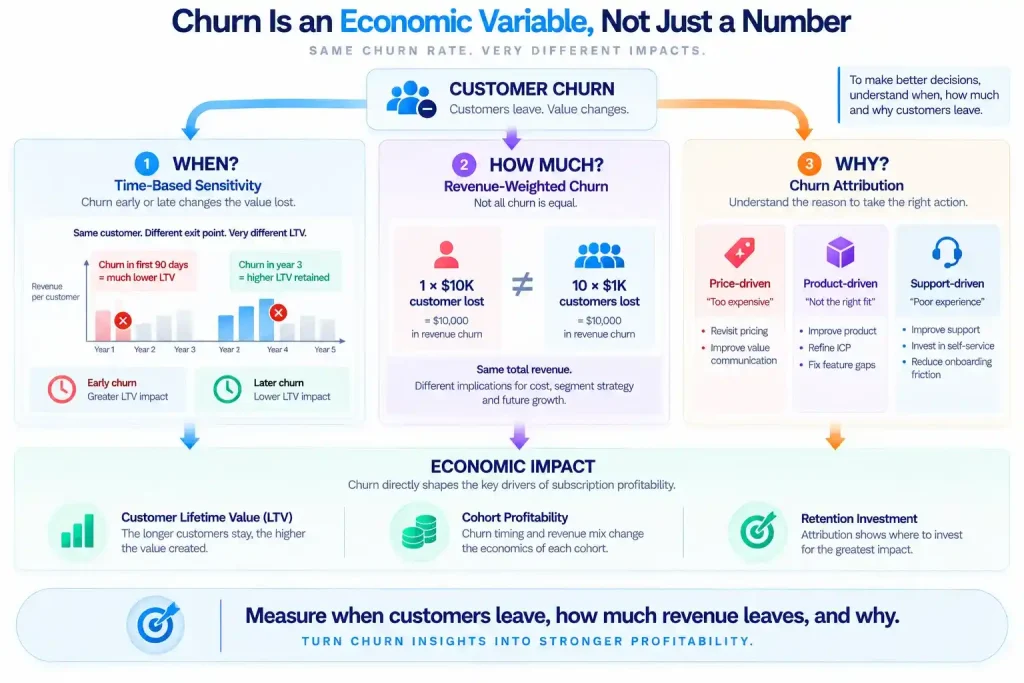
Three layers turn churn into something a profitability model can actually use.
- Time-based sensitivity, since churn inside the first 90 days destroys far more lifetime value than churn in year three
- Revenue-weighted churn: losing one $10K customer differs sharply from losing ten $1K customers
- Churn attribution, distinguishing price-driven churn from product-driven or support-driven churn, so retention investment goes where it actually helps
Designing Profitability Instead of Reporting It
Finance too often shows up to a board meeting with bookings growth and churn improvement, while margin mechanics stay implicit. The more useful posture treats profitability as a design variable from the start. That means tracking how gross margin evolves by product line. It also means watching where cost-to-serve differs between SMB and enterprise, and where fixed cost sits underutilized without anyone noticing.
Case: Building a Margin Expectation Framework
A venture-backed digital marketing and technology company scaled from $9M to $180M in revenue across three funding rounds. It built this kind of discipline into its GTM process. Every dollar of new ARR carried a margin expectation tag. Fast payback with low support and high expansion probability counted as one tier. Moderate complexity with some price erosion risk counted as a second. Custom terms with high support cost and low strategic fit counted as the last. That taxonomy shaped compensation plans and capacity models directly. Over time, sales teams began pursuing the revenue the company wanted to keep, not just any revenue they could close.
Institutionalizing Profitability Across the Organization
Profitability breaks down the moment it becomes a finance department concern rather than a company-wide habit. Three practices keep it distributed.
- A short weekly standup that surfaces one insight from the margin model, explained simply for any function to use
- Finance sitting inside pricing and packaging discussions from day one, as a co-architect rather than a downstream approver
- Cost transparency dashboards that let department heads see their own cost-to-output ratio in near real time
Case: Making Profitability a Shared Habit
A professional services firm scaling from $12M to $63M in revenue within eight months built engagement-level profitability and utilization analytics from a blank page. That visibility gave every practice lead a clear view of where margin was created and where it leaked. The answer no longer stayed buried inside a single consolidated P&L. Profitability stopped being something finance reported after the quarter closed. It became something every team could see in the moment a decision got made.
Three Key Takeaways
- Subscription profitability analysis has to go beyond CAC and LTV. Cohort-level gross margin and a decomposed NRR figure reveal problems a blended average will always hide.
- Fixed costs in a SaaS business are rarely as fixed as they look. Support, infrastructure, and R&D spend should get segmented by customer type. A segment that looks profitable in aggregate can destroy unit economics once fully costed.
- Profitability holds up best when it gets designed into the business early. A margin expectation tag on every dollar of ARR works better than discovering it later, through a disappointing board deck.
Disclaimer: This article is intended for informational purposes only and does not constitute legal, tax, or accounting advice. You should consult your own tax advisor or counsel for advice tailored to your specific situation.
Hindol Datta is a four-time CFO and senior finance executive with over 25 years of leadership experience across cybersecurity, SaaS, gaming, logistics, digital marketing, medical devices, consumer products, and nonprofit organizations. He has led more than $120M in fundraising and over $150M in M&A transactions while building the financial and operational systems that let complex businesses scale with confidence. He is the author of seven books in the Systems CFO Series and holds active CPA, CMA, and CIA credentials.
AI-assisted insights, supplemented by 25 years of finance leadership experience.