
Executive Summary
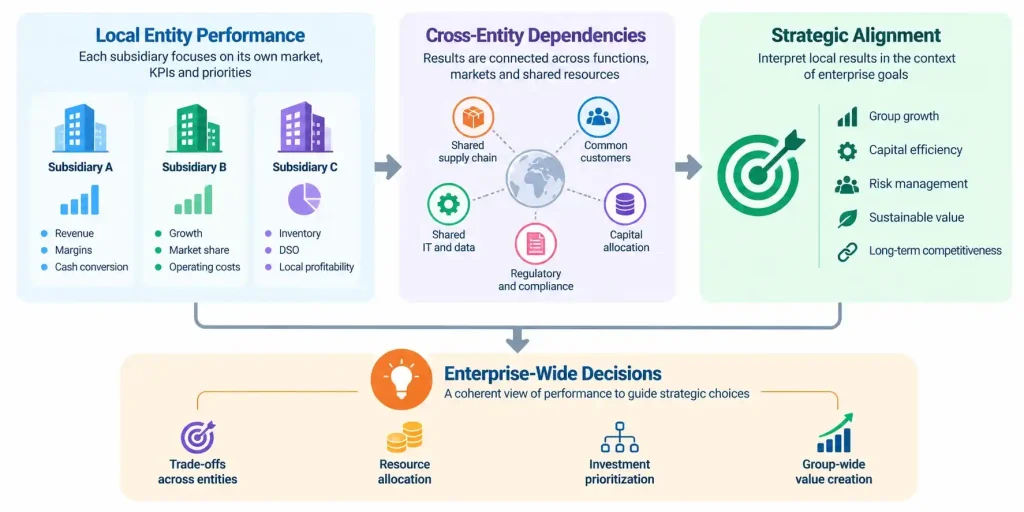
Strategic metrics shape what leaders see, reward, and believe about the business. In a multi-entity enterprise, one subsidiary may excel at cash conversion while another invests heavily in product at the expense of margin. A third may operate under rules where even EBITDA needs local interpretation. Yet the board still expects one coherent account of strategic performance.
The sections ahead explain how CFOs can rethink measurement across entities. They cover the limits of standard metrics, the paradox of local optimization, and the way metrics shape behavior and culture. They also address the CFO’s role as the author of metrics that guide decisions. Together they show measurement as an act of interpretation, not just reporting.
The Illusion of Precision in Standard Metrics
Spreadsheets offer finance leaders a comforting sense of order. Ratios align, columns sum, and dashboards glow with conditional formatting. In a multi-entity operation, however, precision and clarity are not the same thing.
When Harmonized Numbers Hide the Truth
Imagine a dashboard showing strong inventory turnover, healthy DSO, and rising ROIC across a portfolio of subsidiaries. Working capital improves even as customer churn rises, and margins climb in a division whose pricing has not changed. The cause may be timing differences between currency conversion and revenue recognition rules that vary by jurisdiction. Every figure is accurate, yet together they conceal what is happening.
The same metric can carry different meanings across borders. DSO in one country reflects local credit customs, invoice financing, and payment habits that differ elsewhere. Leaders cannot weigh EBIT margins for a North American software unit and a European manufacturer with seasonal labor costs evenly without context. Standard ratios such as ROA, EBITDA margin, and contribution margin are useful, but they are not sufficient on their own.
Adding more KPIs to the dashboard seldom fixes the problem. More granularity often adds noise faster than signal. A smaller set of well-designed strategic metrics, read in relation to one another, usually reveals more than a long list.
Standard Metrics Versus Context-Aware Strategic Metrics
| Approach | What It Measures | What It Reveals |
| Standard ratio | Performance within one entity | Local efficiency, often in isolation |
| Interference metric | How one unit’s results depend on others | Hidden dependencies across the group |
| Friction metric | Costs one unit’s decisions create elsewhere | Consequences that local reports miss |
| Enterprise alignment ratio | Share of local wins that also move group goals | Which KPIs support or undermine strategy |
| Cost of focus estimate | Value of opportunities deliberately declined | The trade-offs behind strategic choices |
A cybersecurity and identity SaaS company with entities in the United States, Canada, Mexico, India, and Nepal shows the value of consistent foundations. Implementing NetSuite across five entities shortened the monthly close from 18 days to 10. A common platform made performance across countries easier to compare on equal terms.
Local Optimization and Strategic Performance
Decentralization usually begins with good intentions: agility, ownership, and respect for local context. Each subsidiary manages its own P&L and adapts its strategy to its market. At first, margins improve in one country and cycle times fall in another.
When Local Wins Become Enterprise Losses
Over time, local success can pull against the whole. One division may chase licensing revenue that cannibalizes subscription growth elsewhere. Another may delay shared IT investment to protect its own EBITDA. A third may build excess inventory to secure volume discounts, straining group working capital. Each unit follows its KPIs perfectly, and the enterprise still suffers.
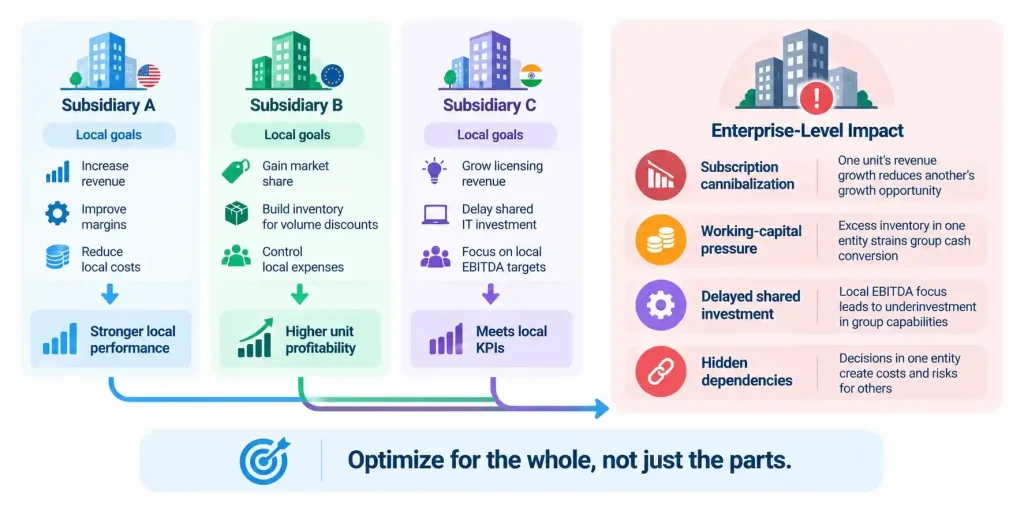
Game theory helps explain this recurring pattern across entities. When each actor optimizes for its own measure, the combined result can be worse than if everyone coordinated. The theory of constraints adds a related insight: a system’s output depends on its bottleneck, not the sum of local efficiencies. That bottleneck may sit in data latency, compliance delays, or resistance to standardization, outside any single P&L.
Local Metrics Versus Enterprise-Aligned Metrics
| Dimension | Local Metric Design | Enterprise-Aligned Design |
| Primary goal | Maximize unit profitability | Maximize system throughput and value |
| Shared costs | Avoided to protect unit results | Funded when they benefit the group |
| Incentives | Tied only to local targets | Blend local results with group contribution |
| Visibility of side effects | Rarely tracked | Logged and quantified across entities |
| Role of finance controllers | Guard local margins | Connect insight across functions and units |
The answer is not full centralization, which assumes one metric system can capture every local nuance. Instead, CFOs can make the assumptions behind each metric explicit, including its time horizon and the behaviors it rewards. They can also map second-order effects and judge managers partly on their contribution to group results.
A Euronext Paris-listed gaming company with operations in the United States, France, the United Kingdom, Singapore, and South Korea illustrates this balance. Finance there maintained reporting under both IFRS and US GAAP while leading a team of more than 15 professionals. Its firmwide rollout of Oracle Financials and MicroStrategy created a single definition of revenue across every subsidiary.
How Strategic Metrics Shape Behavior
A number does not speak until someone gives it meaning. A churn rate of 5.4% may sit comfortably below a 6% target, yet leave a room unsure what it says about customers or product. Metrics are not neutral; they frame which story gets told.
Incentives, Narratives, and Goodhart’s Law
Goodhart’s law captures the core risk: when a measure becomes a target, it stops being a good measure. Consider six regional subsidiaries each given the same 12% quarterly growth target. In a saturated market, that target signals unrealistic expectations, while in an emerging market it signals confidence. One manager may inflate forward bookings, another may defer expenses, and a third may discount heavily to hit the number.
Service metrics often show the same weakness in practice. A time-to-resolution target can drive response times down while employees close tickets early and reopen them later. On paper, performance improves; in reality, service declines. The fix lies less in punishing manipulation and more in understanding why the metric invited it.
CFOs can reduce these risks with a few deliberate practices:
- Explain the story each metric is meant to tell and test it against strategy
- Invite local leaders to describe what a metric means in their market before reviewing results
- Pair targets with context so that the same number is read appropriately across regions
- Retire or revise metrics that no longer reflect how the business creates value
A professional services firm with five business units offers a relevant example. Finance built engagement-level profitability and utilization analytics from scratch. Those measures revealed where the business created margin and where it leaked, changing how leaders judged performance across units.
The CFO as Author of Strategic Metrics
Choosing, defining, and publishing a metric shapes what people believe and how they act. Metrics, in this sense, are compositions instead of neutral reports. The CFO carries a particular responsibility for what those compositions say.
Measuring What Strategy Truly Costs
Picture a planned spin-off of a legacy unit with modest EBITDA but heavy demands on management attention. The financial case looks clean, yet the binders frame higher shared service costs and lost IT capacity as one-time transaction costs. Measuring leadership continuity risk and the strategic focus at stake might lead leaders to restructure the unit internally instead. In that case, better metrics change the decision itself.
Some of the most useful strategic metrics resist perfect definition. A measure of how quickly a new customer moves from transactional to advisory relationships might draw on repeat engagement, expansion speed, and support depth. Such a measure is imperfect but honest, and it can reshape account strategy.
Negative metrics deserve a place in the system as well. Every strategy leaves something unbuilt, yet traditional reports ignore those absences. An estimate of the opportunities deliberately declined reminds leaders that focus has a price and that some value lies in restraint.
A marketplace SaaS company with operations in the United States and Poland shows the value of thoughtful metric design. Consolidated cross-border reporting and cohort and unit economics models anchored investor diligence during a $20M Series B. Those measures gave investors a clear view of how each part of the business contributed to strategic performance.
Strategic metrics, authored with care, become a compass for the enterprise. They will never capture everything, but they can orient decisions, reveal trade-offs, and keep local and group goals in conversation.
Three Key Takeaways
- Standard ratios can conceal more than they reveal across entities, so strategic metrics must account for local context and cross-unit dependencies.
- Strategic performance improves when incentives blend local results with group contribution and when finance tracks side effects across entities.
- CFOs who author metrics deliberately, including measures of friction and opportunity cost, turn measurement into a tool for better decisions.
Disclaimer: This article is intended for informational purposes only and does not constitute legal, tax, or accounting advice. You should consult your own tax advisor or counsel for advice tailored to your specific situation.
Hindol Datta is a four-time CFO and senior finance executive with over 25 years of leadership experience across cybersecurity, SaaS, gaming, logistics, digital marketing, medical devices, consumer products, and nonprofit organizations. He has led more than $120M in fundraising and over $150M in M&A transactions while building the financial and operational systems that let complex businesses scale with confidence. He is the author of seven books in the Systems CFO Series and holds active CPA, CMA, and CIA credentials.
AI-assisted insights, supplemented by 25 years of finance leadership experience.