
Executive Summary
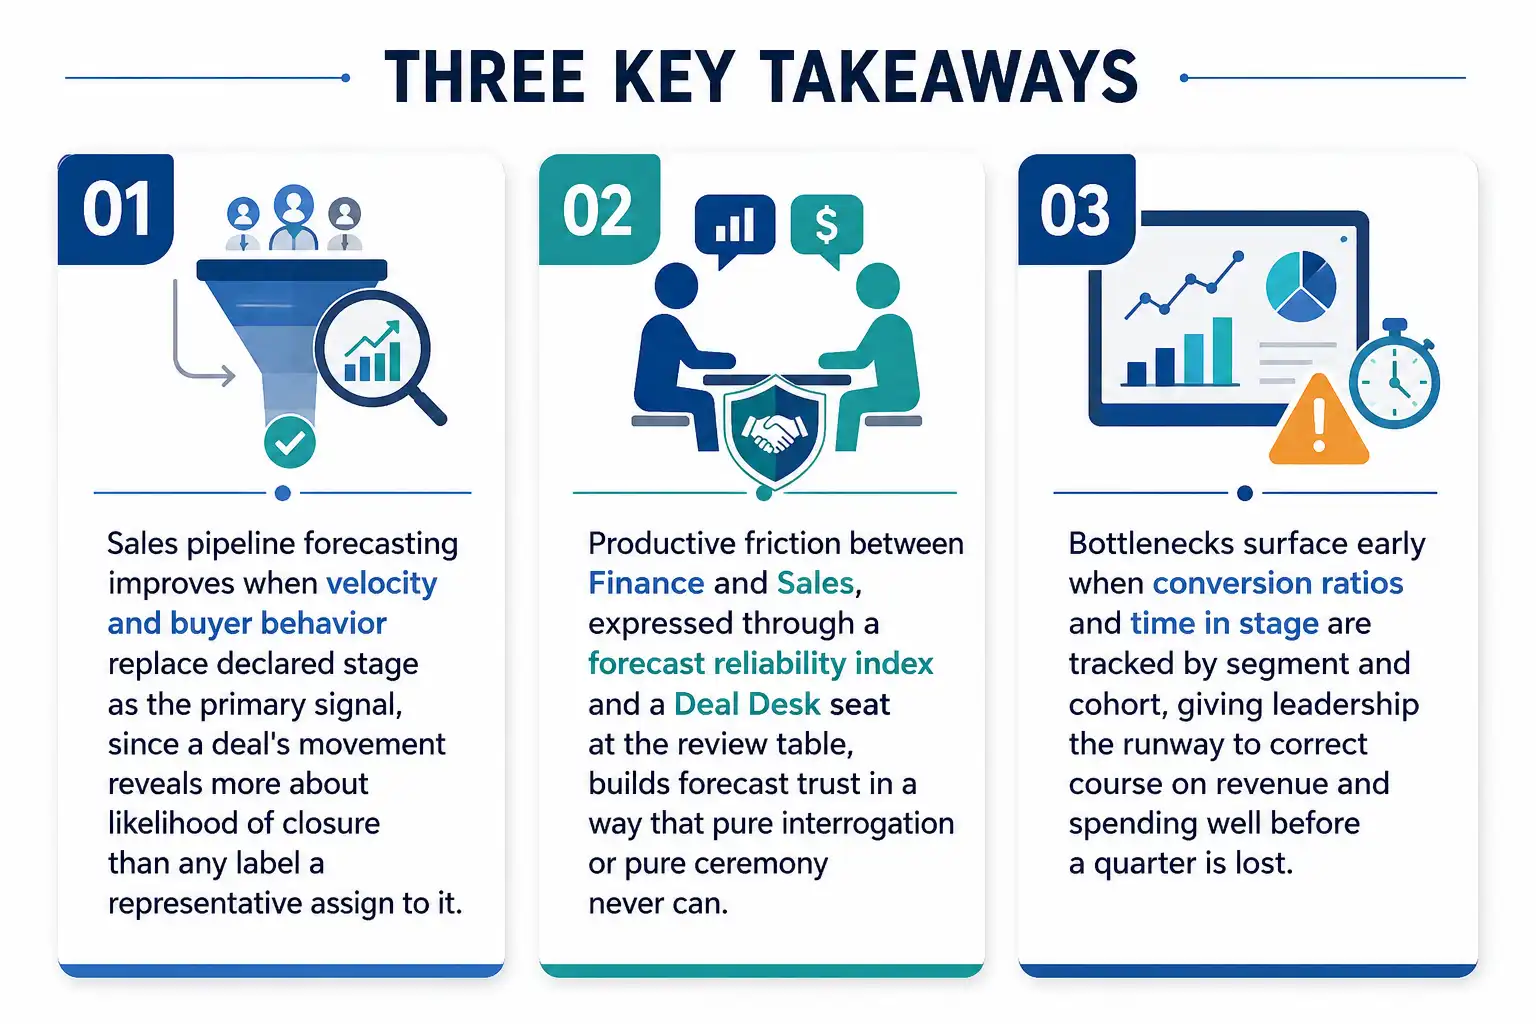
Most organizations still treat sales pipeline forecasting as a monthly checkpoint, a ritual in which numbers are presented and then defended rather than genuinely understood. Reframed correctly, the pipeline review becomes one of the most valuable diagnostic tools a finance organization has, tracing a shift away from static, stage-based forecasting toward a model anchored in velocity, conversion patterns, and observable buyer behavior. Productive friction between finance and sales strengthens forecast reliability, the Deal Desk earns a seat at the forecast table, and early bottleneck detection protects a quarter before the final numbers arrive.
No forecast is ever perfect, and sales pipeline forecasting done well does not pretend otherwise. What it produces instead is a shared, defensible view of reality, one that lets leadership allocate capital and attention with confidence well before a quarter reveals its own surprises.
Why Sales Pipeline Forecasting Deserves a Second Look
Sales pipeline forecasting carries a reputation problem in many organizations, where it functions as a validation ritual rather than a diagnostic exercise: numbers go in, a forecast comes out, and the cycle repeats until the next checkpoint arrives. Across more than 25 years of finance leadership spanning cybersecurity, SaaS, gaming, logistics, digital marketing, medical devices, and nonprofit organizations, that view changes considerably. The pipeline review starts to resemble a tuning fork for the go-to-market engine, revealing organizational maturity through how finance and sales interact. Adversarial dialogue makes forecasts drift, ceremonial dialogue lets deals stall unnoticed, and genuine collaboration turns disagreement into clarity.
Early in a finance career, the pipeline review often looks like an interrogation, hard questions challenging optimistic assumptions while the answers reflect hope more than truth. Representatives defend their calls, and everyone leaves with a version of the quarter they can live with, though rarely one anyone fully believes. The turning point arrives when the reviewer stops acting as judge and becomes a participant instead.
From Volume to Velocity: The Language of Pipeline Flow
A typical pipeline review opens with a familiar stack of figures: total pipeline value, coverage ratio, deal count by stage, average deal size, and projected close dates. These numbers describe activity, but rarely truth, since every figure conceals human judgments about timing, intent, and qualification that a spreadsheet cannot see. Finance earns credibility not by interrogating every number but by placing it in context, and a useful starting question is simple: which parts of the pipeline are moving, and which have gone quiet? Velocity reveals conviction in a way raw volume never does. Deals that stall usually point to weak qualification, while deals that accelerate unexpectedly often carry hidden risk beneath their urgency.
Pattern Recognition Over Pipeline Quantity
Consider a quarter where headline coverage looked strong, well above three times pipeline to target, and yet something still felt off. The deal mix showed a concentration of late-stage opportunities from a newer segment that historically took longer to close, carrying marginal fit scores and implementation estimates that had grown by nearly 40%. The pipeline looked healthy on the surface. Underneath, it was fragile.
Because the team had built a habit of reviewing pipeline by fit cohort, the risk surfaced early enough to act on. The forecast was reweighted and enablement shifted toward better-fit segments. The quarter closed tighter.
The Role of Friction in Building Sales Pipeline Forecasting Trust
Most pipeline review processes aim to eliminate friction entirely, since everyone wants deals to close sooner. Not all friction proves harmful, though; the right kind sharpens forecast quality rather than eroding it. Finance introduces productive friction by challenging assumptions with empathy and evidence. Asking why a deal advanced without an economic buyer reminds a team that activity is not intent, and pointing out that a region’s win rate declined even as volume climbed prompts a conversation about deal quality, a moment of tension that forces useful introspection rather than conflict.
One mechanism worth adopting tracks forecast reliability by region, comparing submitted forecast against actual results and weighting the gap by fit and stage velocity:
- Submitted forecast versus closed-won revenue, tracked by region and by quarter
- Win rate trends measured against pipeline volume, isolating quality from activity
- Fit-score weighting applied to the gap so stronger-fit regions are held to a tighter tolerance
- Stage velocity as a modifier, since a region moving deals faster earns a different confidence band than one moving slowly
Regions with stronger reliability earn more budget flexibility, while volatile regions receive additional scrutiny, not as punishment but as a way of aligning resourcing with credibility. This discipline compounds beyond a single quarter. At a mission-driven education and research institution, sharper pipeline and enrollment forecasting became part of a larger story that included a capital raise of $37M in equity and venture debt, since investors trust numbers that have survived genuine scrutiny far more than numbers presented without challenge.
Integrating the Deal Desk into the Sales Pipeline Review
One group frequently holds more pipeline insight than anyone realizes and yet remains absent from the forecast conversation: the Deal Desk. Too often treated as a back-office checkpoint rather than a source of intelligence, it carries an intimate view of deal complexity, pricing friction, and risk patterns that never appear on a CRM dashboard.
Inviting the Deal Desk leader into the forecast call, not to approve individual deals but to surface trends, changes the review in a consequential way. A Deal Desk analytics layer typically tracks:
- Quote generation velocity, from initial request to delivered quote
- Frequency of legal exceptions and the representatives generating them
- Approval escalations by deal size and by representative
- The ratio of quotes issued to deals closed-won, alongside discount leakage by segment
The useful question shifts from whether the customer is engaged to how many redlines legal has flagged, a systemic proxy for deal integrity rather than an anecdotal check. This layer of visibility helps distinguish real revenue from theoretical optimism.
The same discipline applies to acquired pipeline. Overseeing more than $100M in cross-border acquisitions within gaming and digital entertainment made clear how quickly an acquired company’s pipeline assumptions can diverge from the acquirer’s own standards.
Moving Beyond Static Stage Probabilities in Sales Pipeline Forecasting
Stage-based forecasting has long been the default, with most CRMs assigning a fixed probability, 20%, 50%, 90%, based purely on declared stage. This fails to capture the real dynamics of buying behavior, since not every deal sitting at 50% carries the same likelihood of closing. Modern sales pipeline forecasting earns its keep here, replacing a fixed number with a probability that reflects what the buyer has done.

Behavioral signals map to a measurable likelihood of closure based on historical conversion patterns:
- Multi-threading across three or more stakeholders, rather than a single champion
- Executive sponsor engagement confirmed through a direct meeting or call
- Technical validation or proof-of-concept completed rather than merely scheduled
- Security or procurement review initiated ahead of the final negotiation stage
Combined with deal metadata, tenure, and account fit score, these signals produce a dynamic model treated as signal rather than gospel, one finance can use to simulate scenarios and sales can use to coach the next best action.
Detecting Pipeline Bottlenecks Before They Break the Quarter
Revenue misses rarely happen suddenly. They build quietly through pipeline friction that goes unnoticed until the damage is done. Treating the pipeline as a system with flow rates and pressure points, rather than a static list, allows problems to surface earlier. A short set of early-warning indicators tends to catch trouble before the numbers do:
- Conversion ratio tracked by segment, persona, and representative cohort
- Median time in stage, flagged when a deal lingers past the segment norm
- Discount request frequency, watched for sudden increases within a single quarter
- Competitive loss reasons, reviewed weekly rather than at quarter close
A region where conversion slows always points to something, whether under-qualification, a shift in competitive positioning, or seasonality. Monitoring median time in stage serves a similar purpose, since deals that linger too long usually reveal a structural misfit.
Early detection carries a direct financial payoff. At an early-stage email marketing and community technology company, tightening pipeline and expense visibility helped bring monthly burn down from $800K to $200K, since bottlenecks in revenue rarely stay isolated from cost. In one instance, a product line showed a 35% increase in average time in stage, and deeper analysis revealed that a competitor had changed pricing and was winning more head-to-head deals while messaging had not yet adjusted, an anomaly that surfaced well before a lagging win-and-loss analysis would have caught it.
Closing the Gap Between Intuition and Forecast Precision
The real value of a cross-functional pipeline review is not perfect accuracy. It is directional alignment. When finance and sales examine the same dataset and reach the same conclusion, risk becomes transparent, accountability spreads across the organization, and decisions move faster. The best reviews stop defending a forecast and start understanding performance, celebrating well-structured pipeline as much as closed revenue.
Three Key Takeaways
Disclaimer: This article is intended for informational purposes only and does not constitute legal, tax, or accounting advice. You should consult your own tax advisor or counsel for advice tailored to your specific situation.
Hindol Datta is a four-time CFO and senior finance executive with over 25 years of leadership experience across cybersecurity, SaaS, gaming, logistics, digital marketing, medical devices, consumer products, and nonprofit organizations. He has led more than $120M in fundraising and over $150M in M&A transactions while building the financial and operational systems that let complex businesses scale with confidence. He is the author of seven books in the Systems CFO Series and holds active CPA, CMA, and CIA credentials.
AI-assisted insights, supplemented by 25 years of finance leadership experience.