
Executive Summary
Performance indicators decide whether a multi-divisional enterprise speaks with one voice or with six. The CFO owns the grammar of that conversation. This article explains how to design performance indicators around economic value. It also covers how to balance enterprise standards against divisional needs, steer capital with a KPI framework, and govern the system as strategy shifts.
Measurement is a strategic asset and not a reporting obligation. Readers will find six design tests and a two-layer architecture of core and contextual metrics. A governance model then keeps the scorecard honest.
Designing Performance Indicators That Drive Enterprise Value
A company with a single business can manage with a single dashboard. Growth by geography, product, segment, or acquisition changes that. Each division then carries its own P&L, talent model, and culture. Finance inherits a mosaic of KPIs, few of which align.
Poorly designed performance indicators do more than add noise. Every division will optimize for whatever the scorecard rewards. Effective design starts with what success looks like at the economic core of the business. A sound performance indicator is a signal strong enough to travel across organizational layers intact.
Six Tests of a Strong Performance Indicator
- Aligned with value creation: the metric translates activity into EBITDA, free cash flow, lifetime value, or return on capital. A growth division may track acquisition cost against lifetime value, while a mature division tracks operating margin.
- Actionable: a leader who sees the number move must know which lever to pull, which excludes measures such as website traffic that connect to no controllable input.
- Comparably defined: two divisions may both report gross margin while one includes freight. Gaps of that kind erode executive trust in the numbers.
- Few in number but broad in coverage: a core set of financial, operational, and strategic measures anchors the framework. Divisional metrics supplement it, since churn matters to SaaS units but not to equipment makers.
- Longitudinally consistent: a three-year trendline on stable methodology tells a more honest story. A metric redefined each fiscal cycle does not. Any change to a definition should be rare, justified, and transparent.
- Connected to behavior: leaders must understand why a metric exists and trust that it is fair. That usually requires onboarding sessions and open forums.
The comparability test proved decisive at a public gaming and digital entertainment company with operations in five countries. A single definition of revenue was rolled out across every subsidiary through a unified ERP and business intelligence platform. Statutory reporting cycles shortened under both IFRS and US GAAP.
Balancing Standard and Contextual Performance Indicators
One division may run a high-volume, low-margin operation. Another may sell complex enterprise contracts over long cycles. A third may behave like a startup investing for tomorrow’s markets. A single set of metrics describing all three invites superficiality or distortion, yet investors still expect one coherent story.
Core and Contextual Performance Indicators
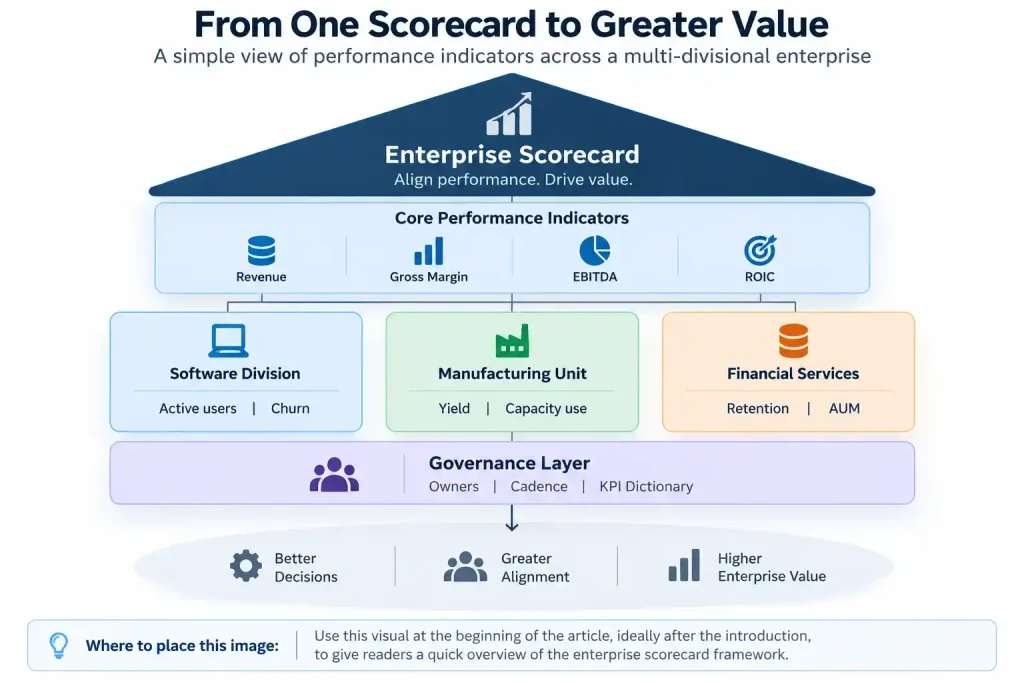
The practical answer is a two-layer system built on shared foundations. The first layer holds non-negotiable performance indicators that every division reports on identical, auditable definitions: revenue, gross margin, EBITDA, working capital, and return on invested capital, plus strategic measures such as net promoter score where the company has made long-term commitments. The second layer holds contextual indicators that reflect each business model, such as active users and churn for software, yield and capacity utilization for manufacturing, or client retention and assets under management for financial services.
At a professional services firm with five business units, engagement-level profitability and utilization analytics gave leadership the first clear view of where margin was created and where it quietly leaked.
Governing Definitions, Benchmarks, and Targets
A centralized KPI dictionary maintained by finance, IT, and operations records each metric name, formula, source, frequency, and owner. CFOs should also convene forums where division leaders discuss what a 25% gross margin means in a high-growth SaaS business compared with a mature industrials segment, because teams embrace metrics when the reasoning is explained and local input is invited.
Three cautions apply to the way this layer is designed and applied:
- Benchmarking: compare trajectory and efficiency against each division’s own history and risk profile, since EBITDA margins across units with different capital intensity often mislead.
- Goal setting: a 10% growth target may suit an emerging market division and be unrealistic for a saturated domestic business, so stretch targets must rest on strategic logic.
- Controlled deviation: temporary substitutions, such as pilot conversion rate in place of acquisition cost during a launch, should be documented, approved, and time-bound.
Using Performance Indicators to Guide Capital Allocation
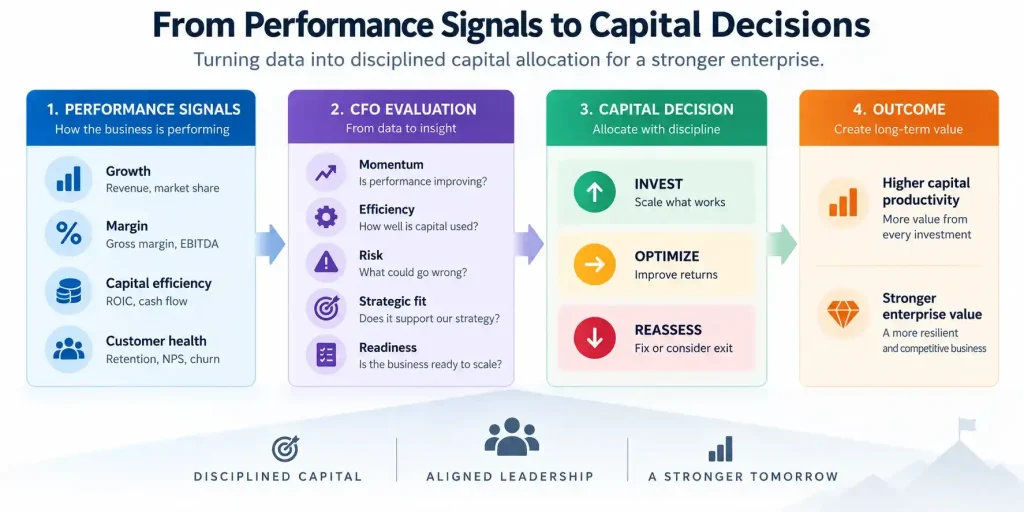
Capital allocation is a bet on future returns, and performance indicators supply the signal that separates the division with the best history from the division best positioned to create future value. The starting lens is capital productivity, which combines return on invested capital, asset efficiency, operating leverage, and strategic leverage instead of relying on the P&L alone.
Reading Momentum, Efficiency, and Risk
Consider one division with flat revenue and high margins beside another with negative margin but accelerating customer acquisition. A backward-looking model favors the first, while a forward-looking KPI framework asks about the growth division’s LTV to CAC ratio, its margin expansion at scale, and the maturation of customer cohorts. Capital efficiency sharpens the picture, since a 15% EBITDA margin on $100M in assets can be less efficient than 10% on $40M, which capital turnover exposes.
Indicators also work as early warning systems, since a division growing 25% annually may attract funding while satisfaction scores erode or a strong balance sheet masks declining NPS, and signals of that kind prompt reallocation or divestment before instability compounds.
At a $127M global consumer products company, inventory turns rose from 3x to 7x through demand planning, SKU rationalization, and logistics optimization, which released trapped working capital and transformed cash conversion.
Strategic Relevance, Interdependency, and Readiness
Short-term metrics do not always capture strategic relevance, so a division in a nascent market deserves scoring models covering market attractiveness, competitive position, and regulatory exposure. Shared services such as a central data science team deserve evaluation on contributive performance, meaning how much they raise productivity elsewhere, and should not be penalized for lacking direct revenue.
Internal capital markets work best when politics gives way to performance. Published investment criteria reward divisions that demonstrate readiness, scalability, and strategic alignment, while lagging units receive diagnostics in place of additional budget. Readiness deserves its own test, covering the bandwidth to deploy funds, systems that support scale, and infrastructure that can absorb added volume. Forecasts should then be compared with actuals and ROI assumptions stress-tested afterward, so the framework learns from every investment. CFOs who explain which performance indicators feed investment decisions earn credibility, whereas opaque rules invite second-guessing.
Governing Performance Indicators Over Time
Design is a considerable achievement, yet mastery lies in governance, because markets shift and even carefully built KPIs erode under ambiguity, inertia, or strategic drift. The CFO serves as steward of integrity and architect of evolution.
Ownership, Cadence, and Incentives
- Ownership: every indicator needs an accountable executive, often two, with one at the enterprise level for consistency and one at the divisional level for context.
- Cadence: monthly operating reviews, quarterly deep dives, and annual planning sessions should share one KPI framework and trigger diagnosis, so a decline in gross margin starts an investigation.
- Golden KPIs: the few indicators tied directly to incentives, capital decisions, and strategic milestones form the spine of the scorecard, while everything else is context.
- Incentives: a balanced scorecard linked to bonuses and promotion criteria sharpens accountability, such as bookings and net revenue retention for sales or time-to-market for product.
At a cybersecurity and identity access management company with $30M in ARR, a driver-based forecasting engine and disciplined reporting cadence held actuals within plus or minus 5% of forecast for 8 consecutive quarters, while an ERP implementation compressed the monthly close from 18 days to 10.
Evolving and Retiring Indicators
Strategy shifts demand new metrics: geographic expansion introduces localization and regulatory readiness, while a move from license sales to subscriptions introduces recurring revenue, churn, and customer lifetime value. Changes should pass through a governance council led by finance and operations and should never occur mid-year without a stated rationale. Regular reviews of the KPI inventory retire any performance indicator that has outlived its usefulness, which is stewardship and not tinkering.
Business intelligence platforms can standardize dashboards and alert on threshold breaches, yet only human judgment can tell whether falling engagement reflects a UX flaw or a market signal. Culture completes the system: measurement that punishes experimentation breeds risk aversion, while gamed or misrepresented metrics must carry consequences. Every leader should see the same metrics, definitions, and cadence, so that no discrepancy appears between board meetings and investor calls.
Three Key Takeaways
- Design each performance indicator around value creation and comparability, using a small core set on identical definitions plus contextual metrics that reflect each division’s business model.
- Link performance indicators to capital allocation through momentum, capital efficiency, risk signals, and readiness, and publish the criteria so that performance replaces politics in investment decisions.
- Govern the scorecard with named owners, a fixed review cadence, golden KPIs tied to incentives, and a disciplined process for changing or retiring performance indicators.
Disclaimer: This article is intended for informational purposes only and does not constitute legal, tax, or accounting advice. You should consult your own tax advisor or counsel for advice tailored to your specific situation.
Hindol Datta is a four-time CFO and senior finance executive with over 25 years of leadership experience across cybersecurity, SaaS, gaming, logistics, digital marketing, medical devices, consumer products, and nonprofit organizations. He has led more than $120M in fundraising and over $150M in M&A transactions while building the financial and operational systems that let complex businesses scale with confidence. He is the author of seven books in the Systems CFO Series and holds active CPA, CMA, and CIA credentials.
AI-assisted insights, supplemented by 25 years of finance leadership experience.