
Executive Summary
Revenue is the story a company talks about performance. For professional services firms running long, multi-period engagements, that story can drift from reality fast. The percentage of completion method is the mechanism that keeps it honest. I have built and defended PoC accounting across cybersecurity, professional services, and consumer products businesses. Over time, I have come to see it less as a compliance exercise and more as a discipline. It forces finance, delivery, and leadership to agree on what progress actually means before the number ever reaches the board.
This article works through when ASC 606 requires over-time recognition and how to choose between input and output measures. It walks through a full cost-to-cost calculation with journal entries. It covers the pitfalls that most often trigger audit scrutiny. And it lays out the dashboard structure that keeps PoC accounting defensible month over month. No scrambling to reconstruct it at quarter end.
Why the Percentage of Completion Method Matters in Professional Services
Consulting, systems integration, and other project-based engagements routinely run for months or years. The percentage of completion method exists to prevent a mismatch. Cash, billing, and delivery all move on different clocks, and PoC keeps them from telling three different stories. Under the prior guidance, PoC recognized revenue as a firm incurred costs. ASC 606 keeps that logic. But it wraps it inside a five-step model that centers on the transfer of control, not the passage of effort.
Applied well, PoC accounting avoids a jarring problem. Projects close, and the numbers do not need to catch up to reality all at once. It gives boards and clients a running view of project health, rather than a single verdict delivered at the end. In one cybersecurity and identity access management company I supported, we built the ASC 606 revenue recognition framework from nothing. The controls environment followed the same path. Board-grade reporting followed the same path. That documentation later carried the business through acquisition diligence without a single restatement. That experience taught me that the framework is not paperwork sitting behind the numbers. It is the evidence a buyer, auditor, or board member reaches for the moment they stop trusting a headline figure and start asking how the team built it.
Confirming Over-Time Recognition Under ASC 606
Before applying the percentage of completion method, a firm needs to confirm that it satisfies at least one of three conditions in ASC 606: the customer simultaneously receives and consumes the benefit of the work as the firm performs it, the services create or enhance an asset the customer controls, or the work produces an asset with no alternative use alongside an enforceable right to payment for performance completed to date.
Most professional services engagements clear the first bar without much debate, since clients consume consulting, integration, or training as the firm delivers it rather than waiting for a finished product to arrive. Once a firm confirms that condition, the real judgment begins, because the standard does not tell it which measure of progress to use. It only requires that the firm consistently apply whichever measure it chooses across similar obligations, and that the measure reflect the transfer of value to the customer.
Choosing Between Input and Output Measures for PoC Accounting
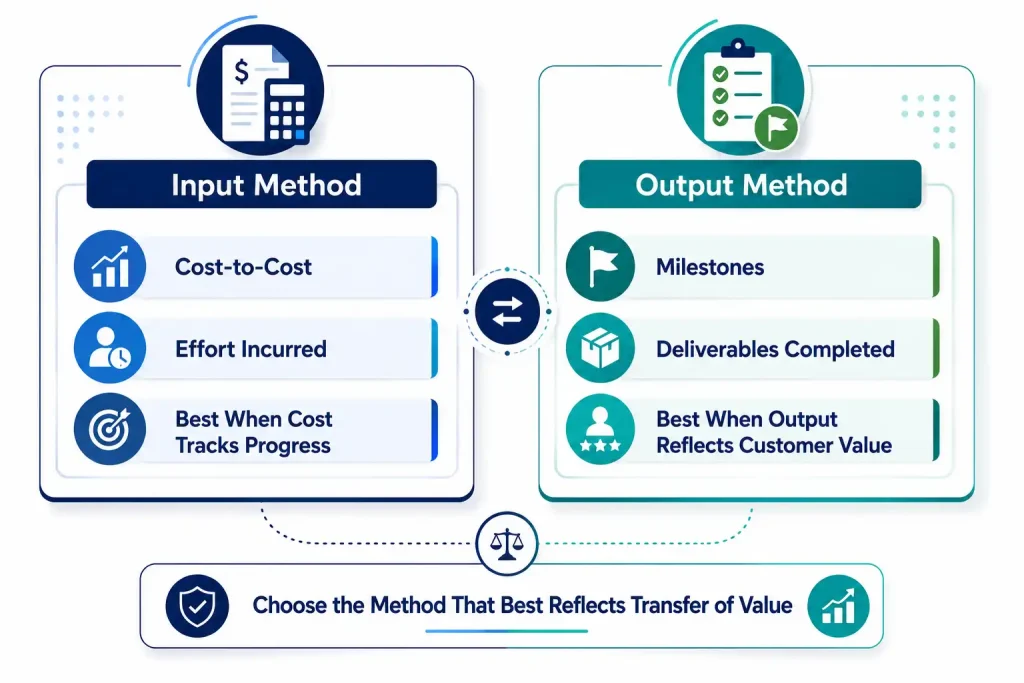
ASC 606 allows two families of progress measurement, and the choice between them shapes everything downstream, from the monthly close to the story told to investors.
Input Methods
Cost-to-cost remains the most common approach in PoC accounting. If a project has incurred $200K of costs against an estimated total of $400K, it is treated as 50% complete, and 50% of contract value is recognized accordingly. The method is reliable and easy to audit, though it rests on an assumption that cost incurrence tracks delivered value, which can break down when spending accelerates ahead of actual output.
Output Methods
Milestones, deliverable counts, and completed units measure value delivered rather than effort spent, and they tend to align more closely with how a client experiences the engagement. An implementation contract with three clearly scoped phases is a natural fit for output measurement, though it demands tighter tracking discipline than cost-to-cost. In a professional services firm operating across five distinct business units, we built engagement-level profitability and utilization analytics from the ground up during a period when revenue moved from $12M to $63M in eight months, and that infrastructure is what let leadership see, obligation by obligation, where margin was being created and where it was quietly leaking away.
A Practitioner’s Walkthrough: The Cost-to-Cost Calculation
Consider a firm that signs a $1.2M, ten-month, fixed-fee implementation contract, with total estimated costs of $900K and an implied gross profit of $300K. The firm applies cost-to-cost, revising its estimate as delivery data comes in.
| Stage | Cumulative Cost | Estimated Total Cost | % Complete | Revenue Recognized | Gross Profit |
| Month 3 | $270K | $900K | 30% | $360K | $90K |
| Month 6 (revised estimate) | $540K | $1,050K | 51.43% | $617K cumulative | $77K (period) |
| Month 10 (final) | $1,080K | $1,080K | 100% | $1,200K cumulative | $120K |
By Month 3, the firm records $270K of work-in-progress against payables, then recognizes $360K of revenue and moves the associated cost into cost of goods sold, producing $90K of gross profit. By Month 6, new information pushes the estimated total cost to $1,050K, and the firm records a cumulative catch-up adjustment of $257K in revenue rather than waiting for the change to smooth itself out over future periods. That immediacy is the entire point of the percentage of completion method: it forces bad news and good news into the period where the estimate actually changed, rather than allowing it to drift into whichever quarter is convenient. At completion, actual costs land at $1,080K against a revised estimate of $1,050K, and the project closes at $120K of final gross profit, twelve percent of contract value rather than the twenty-five percent originally underwritten.
Common Pitfalls in PoC Accounting
The failures that surface most often in PoC accounting are procedural rather than conceptual, and they tend to repeat across industries.
- Using cost as the progress measure when client value is actually tied to deliverables, which misstates progress even when the arithmetic is correct.
- Letting total cost estimates go stale, since PoC accounting is only as reliable as the most recent estimate feeding it; a quarterly reassessment discipline is the minimum bar.
- Mixing input and output methods across similar performance obligations, which ASC 606 does not permit and which auditors will flag on sight.
- Allowing inefficient or wasted labor to inflate the progress percentage, when only value-generating cost should count toward completion.
- Treating scope changes as informal understandings rather than documented contract modifications, since revenue cannot be recognized against an obligation that was never formalized.
Building a Dashboard That Keeps PoC Honest
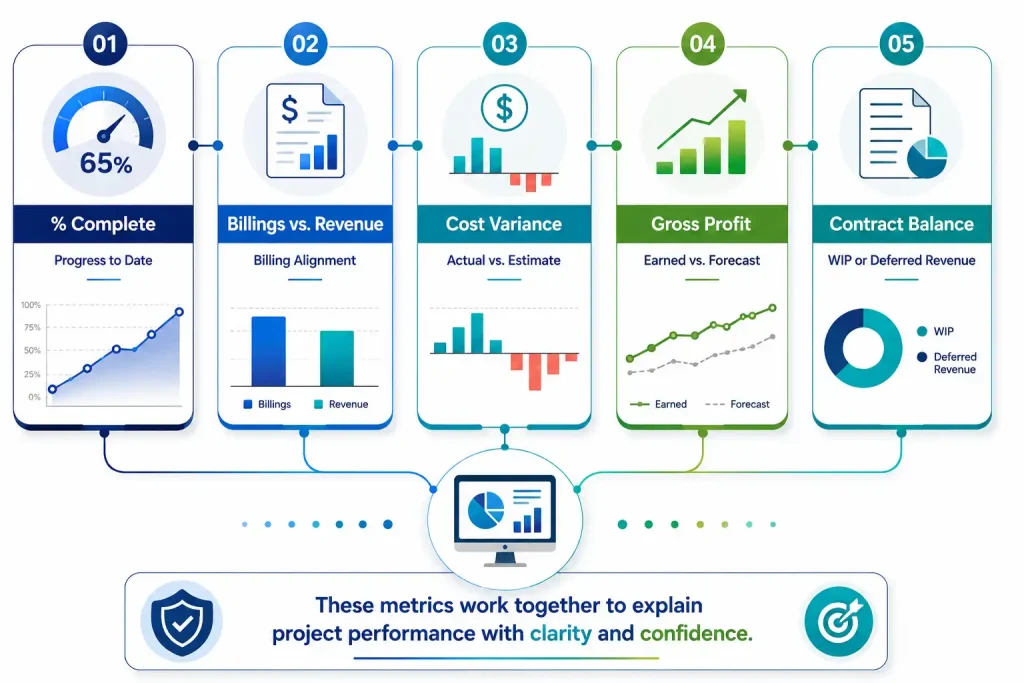
A finance dashboard built around the percentage of completion method should track cumulative percent complete, billings against revenue recognized, cost variance to estimate, earned gross profit against forecast, and the balance sitting in work-in-progress or deferred revenue. The point is not volume of data; it is narrative. A dashboard that shows directional trends lets a CFO explain variance before a board member has to ask about it.
During my time as Chief Financial Officer of a mission-driven education and research institution, I sat with the finance and audit committee on a recurring cadence, and the lesson that carried forward into every subsequent PoC conversation was that boards do not lose confidence over a bad number. They lose confidence when a number moves and nobody can explain why. The same principle holds in professional services: a dashboard that connects percent complete to cost variance and change order activity turns a revenue swing into a story the board has already been told, rather than a surprise finance has to explain after the fact.
Three Key Takeaways
- The percentage of completion method only works when the progress measure, whether cost-to-cost or a milestone-based output, is chosen deliberately and applied with the same consistency across every similar performance obligation in the portfolio.
- Estimate discipline is the load-bearing wall of PoC accounting, and firms that treat quarterly cost reviews as optional will eventually face a catch-up adjustment large enough to draw unwanted audit attention.
- A dashboard built around percent complete, cost variance, and change order activity does more than satisfy reporting requirements; it gives boards and investors the vocabulary to trust revenue as a reflection of delivered work rather than an accounting abstraction.
Disclaimer: This article is intended for informational purposes only and does not constitute legal, tax, or accounting advice. You should consult your own tax advisor or counsel for advice tailored to your specific situation.
Hindol Datta is a four-time CFO and senior finance executive with over 25 years of leadership experience across cybersecurity, SaaS, gaming, logistics, digital marketing, medical devices, consumer products, and nonprofit organizations. He has led more than $120M in fundraising and over $150M in M&A transactions while building the financial and operational systems that let complex businesses scale with confidence. He is the author of seven books in the Systems CFO Series and holds active CPA, CMA, and CIA credentials.
AI-assisted insights, supplemented by 25 years of finance leadership experience.