
Executive Summary
Textbooks define an optimal capital structure as the debt and equity mix that minimizes the weighted average cost of capital. That definition leaves out whether the funding matches what the company exists to do. Capital structure optimization tests strategic intent as much as financial calculation. Every instrument carries its own expectations about speed, risk and control.
The sections below explain how to read the story a cap table tells. They also show how debt, equity and hybrids shape behavior across a company. Later sections cover the early signals of mission drift and how to design capital that protects purpose. The examples come from real raises and the board meetings where their consequences played out.
What Is Optimum Capital Structure Beyond the Textbook Definition
Finance textbooks answer what is optimum capital structure with a tidy formula. It is the blend of debt and equity that lowers the cost of capital while keeping distress at bay. The formula is sound, yet it treats capital as a neutral input. In practice, every dollar arrives with terms that carry expectations about speed, risk and control.
A $37M equity and venture debt raise at a Silicon Valley education and research institution showed this plainly. The finance team built the stack around a long horizon and variable philanthropic funding. The investor narrative then explained why patient capital suited the mission better than a faster alternative. The optimal capital structure there was defined by fit with purpose before it was defined by cost.
Capital Structure as a Statement of Belief
Venture equity is an agreement to pursue scale on the investor’s timeline. Borrowing commits a company to producing predictable cash flow. Public equity, by contrast, works as a quarterly promise to outside parties. Each choice announces what leadership believes about time horizon, risk and independence. Several features of a cap table reveal those beliefs more reliably than a vision statement does.
- A heavy preference stack with participating preferred points to a company built under pressure with limited negotiating leverage.
- A common-heavy cap table at a later stage suggests founders who held their ground or investors who bet on durable upside.
- Venture debt or convertibles at inflection points may reflect smart structuring or quiet desperation, and context separates the two.
- The cadence of fundraising exposes the emotional rhythm of leadership.
A long-term mission can clash with a structure that demands short-term velocity. The spreadsheet may still balance, yet the operating culture begins to fracture.
How Debt, Equity and Hybrids Shape Company Behavior
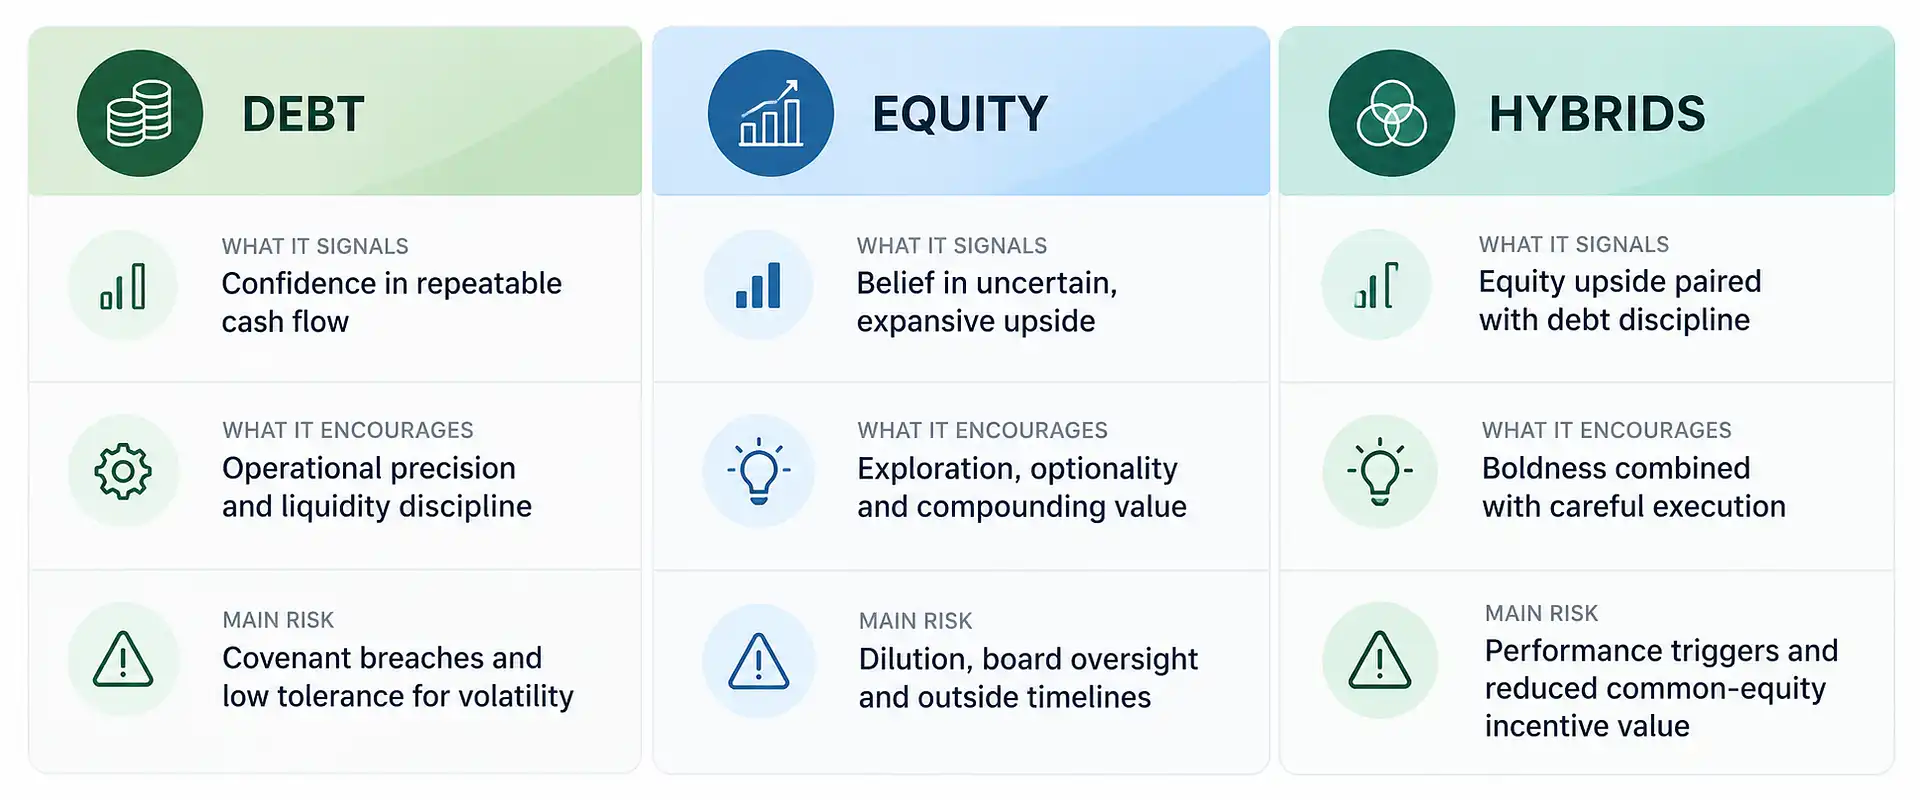
Instruments behave like architecture, since each one suggests how the building should be used. The comparison below summarizes what each form of capital signals, encourages and risks.
Matching Instruments to the Business Model
Debt does not dilute ownership, and it leaves control with the founding team. Yet a missed covenant counts as a violation, while management can explain a missed forecast under equity. Equity grants permission to build something uncertain, though it brings governance oversight and expectations that can distort the original path. Hybrids can be elegant or treacherous, and they change how a CEO views risk and which candidates are willing to join, because sophisticated employees read cap tables closely.
Fit matters more than purity in every one of these choices. A healthcare company on a multi-year clinical path should not carry impatient venture equity, a SaaS company with entrenched enterprise customers can layer modest debt against predictable revenue, and a consumer brand with volatile cash needs may prefer revenue-based financing that flexes with performance.
At a $127M global consumer products company, the $12M in growth financing sat alongside an effort that moved inventory turns from 3x to 7x, and the improved cash conversion meant the facility matched how the business generated and consumed cash. Debt that fits the volatility signature of a company disciplines it, whereas debt that ignores that signature suffocates it.
Recognizing Misalignment Before It Becomes Mission Drift
Drift never announces itself, and it usually begins when a company built on craft accepts equity from a growth fund whose benchmarks were forged elsewhere. The liquidation stack, drag-along rights and aggressive milestones then begin to move its center of gravity through influence rather than force.
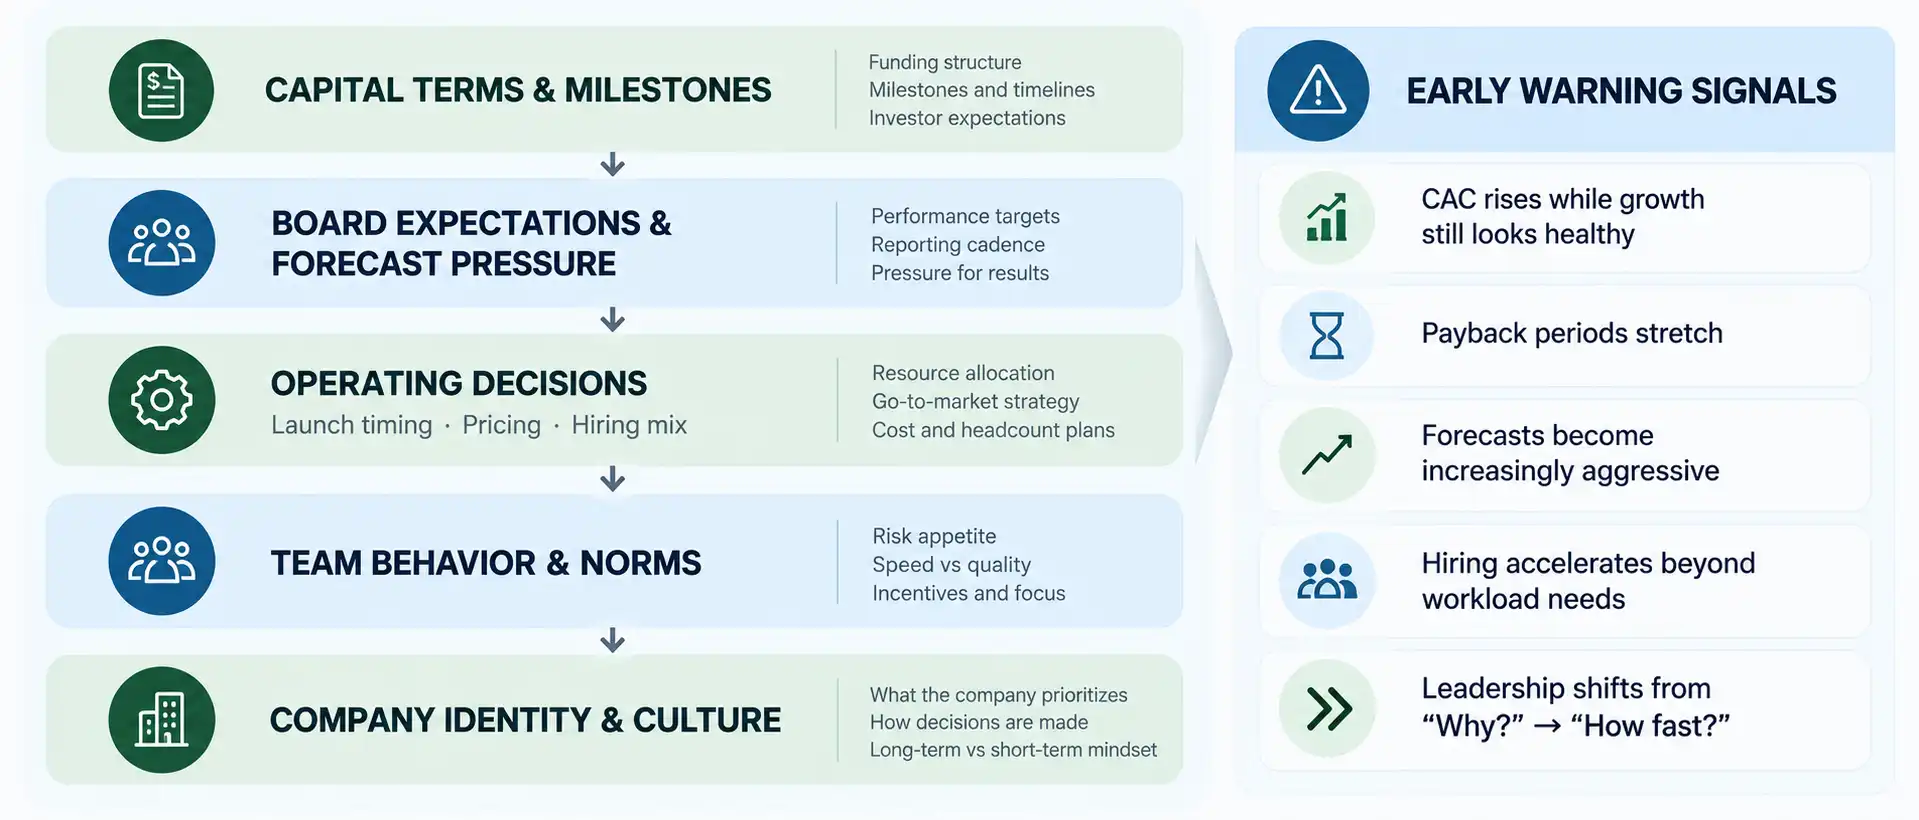
The diagram traces the feedback loop through which capital terms reshape identity, which is why misalignment shows up as disorientation long before it shows up in dollars.
Early Warning Signals for the CFO
At a venture-backed digital marketing company that scaled revenue from $9M to $180M in 24 months while raising $36.5M across three rounds, acquisition cost, lifetime value and contribution margin analytics separated healthy growth from growth that merely satisfied the next board milestone. These patterns deserve close attention in any capital structure review.
- Customer acquisition cost climbs and payback periods stretch while revenue growth still looks healthy.
- Forecasts become more ambitious and less believable from one cycle to the next.
- Hiring accelerates in ways that workload cannot explain, with sales outpacing support.
- Language in executive meetings shifts from why to how fast, and the mission becomes decoration in investor updates.
Once a team begins to question which game it is playing, capital has stopped being fuel and has become a leash.
Capital Structure Optimization as a Design Discipline
Sequencing Capital to the Business Timeline
Every round sets a rhythm, and a rhythm out of step with product readiness produces friction rather than momentum. The useful starting point is a map of what the company must prove in the next 12, 24 and 36 months, and the form of capital follows from it, whether equity that defers control, structured debt that enforces discipline, or a blend with clear boundaries.
Intentional dilution belongs in this toolkit, because what matters is less how much equity is sold than to whom and why. Debt demands equal care, since a covenant package written for subscription revenue can crush a product company mid-retooling. At an early-stage digital marketing technology company, a turnaround that cut monthly burn from $800K to $200K showed how quickly the workable structure changes once runway is treated as a design variable.
Recapitalization and Employee Alignment
During an S-1 and IPO-readiness process at a gaming and digital entertainment company, work with underwriters and Big Four auditors showed how much of a cap table is inherited from a previous version of the business. Recapitalization can flatten a preference stack, buy back early instruments that distort incentives, or bring in secondary capital to release trapped pressure. An ESOP re-struck to reflect real future value turns contribution into co-authorship.
Leading the Board Toward an Optimal Capital Structure
The CFO is the one leader whose view spans strategy, structure, rhythm and return, which makes the role that of convener. That begins with narrative fluency, asking aloud whether a raise reflects what the company still believes and, if not, whether the beliefs changed or the courage did. Boards learn best from case studies of capital timelines that became product shortcuts, while product, talent and engineering leaders need capital explained in terms of their own freedom, motivation and investment pace.
Alignment is a discipline rather than a one-time achievement, so the question of whether the structure still serves the purpose should return every quarter and every time a new investor enters.
Three Key Takeaways
- An optimal capital structure is defined by fit between funding terms and mission before it is defined by the lowest cost of capital, so each instrument should be tested against the time horizon the strategy requires.
- Misalignment appears first in operating behavior, through stretched payback periods and a shift from why to how fast, which makes those signals the early warning system for capital structure optimization.
- The CFO should convene the board and leadership team around capital choices every quarter, using intentional dilution and well-fitted debt to keep the optimal capital structure and the mission moving together.
Disclaimer: This article is intended for informational purposes only and does not constitute legal, tax, or accounting advice. You should consult your own tax advisor or counsel for advice tailored to your specific situation.
Hindol Datta is a four-time CFO and senior finance executive with over 25 years of leadership experience across cybersecurity, SaaS, gaming, logistics, digital marketing, medical devices, consumer products, and nonprofit organizations. He has led more than $120M in fundraising and over $150M in M&A transactions while building the financial and operational systems that let complex businesses scale with confidence. He is the author of seven books in the Systems CFO Series and holds active CPA, CMA, and CIA credentials.
AI-assisted insights, supplemented by 25 years of finance leadership experience.