
Executive Summary
Operating leverage measures how much of each extra revenue dollar reaches operating income. The answer depends on the mix of fixed and variable costs inside the business. Leaders who understand operating leverage can forecast how fast earnings compound after breakeven, and they can see the exposure that appears when revenue falls.
This article explains what operating leverage is, how to measure it, and how operating and financial leverage combine to shape risk. It then shows how business models, capital allocation, and enterprise value all follow from the same cost structure.
What Is Operating Leverage and Why Does It Matter?
Boardroom talk about leverage usually turns to debt: how much the company carries and when it should be repaid. A quieter form sits inside the income statement, where the cost structure decides whether growth produces profit or only activity.
What is operating leverage, and why does it belong in strategic planning? It is the relationship between fixed and variable costs, and the effect of that mix on profit as revenue changes. At low volumes, fixed costs weigh on margins. After breakeven, the same infrastructure, SG&A, and capital base begin to deliver outsized returns.
Many strategy discussions overlook this dynamic in favor of headline growth. Some companies report strong top-line growth while a bloated cost base holds earnings back; others grow modestly yet earn superior returns through disciplined cost design.
How to Measure Operating Leverage
The Degree of Operating Leverage Formula
The cleanest measure is the degree of operating leverage (DOL). It equals the percentage change in operating income divided by the percentage change in revenue. A second form divides contribution margin by operating income, which helps when only one period of data exists.
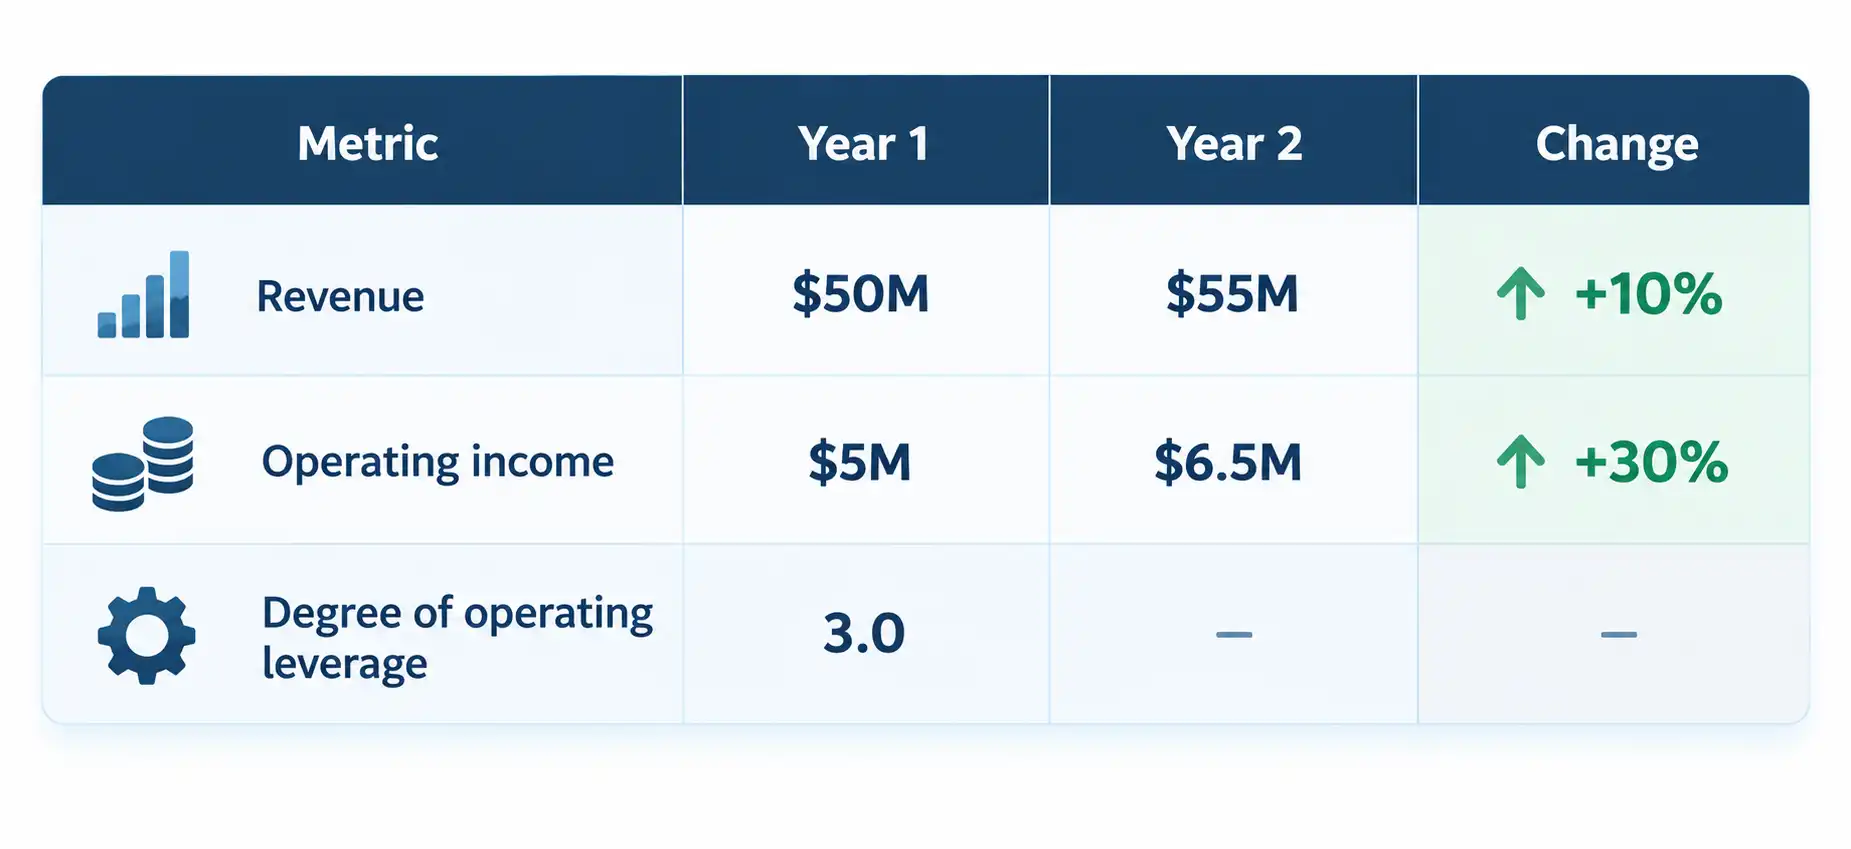
A DOL of 3.0 means each 1% change in revenue moves operating income by about 3%. Tracking the ratio over rolling periods shows how scalable the business is under different demand conditions. In a SaaS company with 80% gross margins and largely fixed SG&A, the path from 5% to 20% operating margin can unfold on modest top-line growth.
Separating Structural from Superficial Leverage
Not all operating leverage is durable, and three distortions deserve attention when reading the ratio:
- Deferred hiring or temporary marketing cutbacks can lift one quarter of earnings without changing the cost structure.
- Step-fixed costs, such as a new warehouse or support team, behave differently from semi-variable costs that creep upward.
- Subscription businesses absorb acquisition costs upfront while revenue is deferred, so customer lifetime value gives a clearer view than GAAP margins alone.
Watching for Negative Operating Leverage
Revenue that grows while margins compress signals weak pricing power, loose cost control, or a sales model that does not match the delivery model. Growth-stage companies often discover too late that acquisition costs are rising faster than expected.
In a professional services firm that scaled from $12M to $63M in revenue within eight months across five business units, engagement-level profitability analytics gave leadership a clear view of where margin was created and where it quietly leaked. A leverage dashboard beside the traditional P&L delivers the same visibility and should include:
- Historical and forecast leverage ratios for each business line
- Breakeven volume thresholds with the assumptions behind them
- Contribution margin profiles for every product or segment
Operating and Financial Leverage: How the Two Compound
Operating Leverage and Financial Leverage Compared
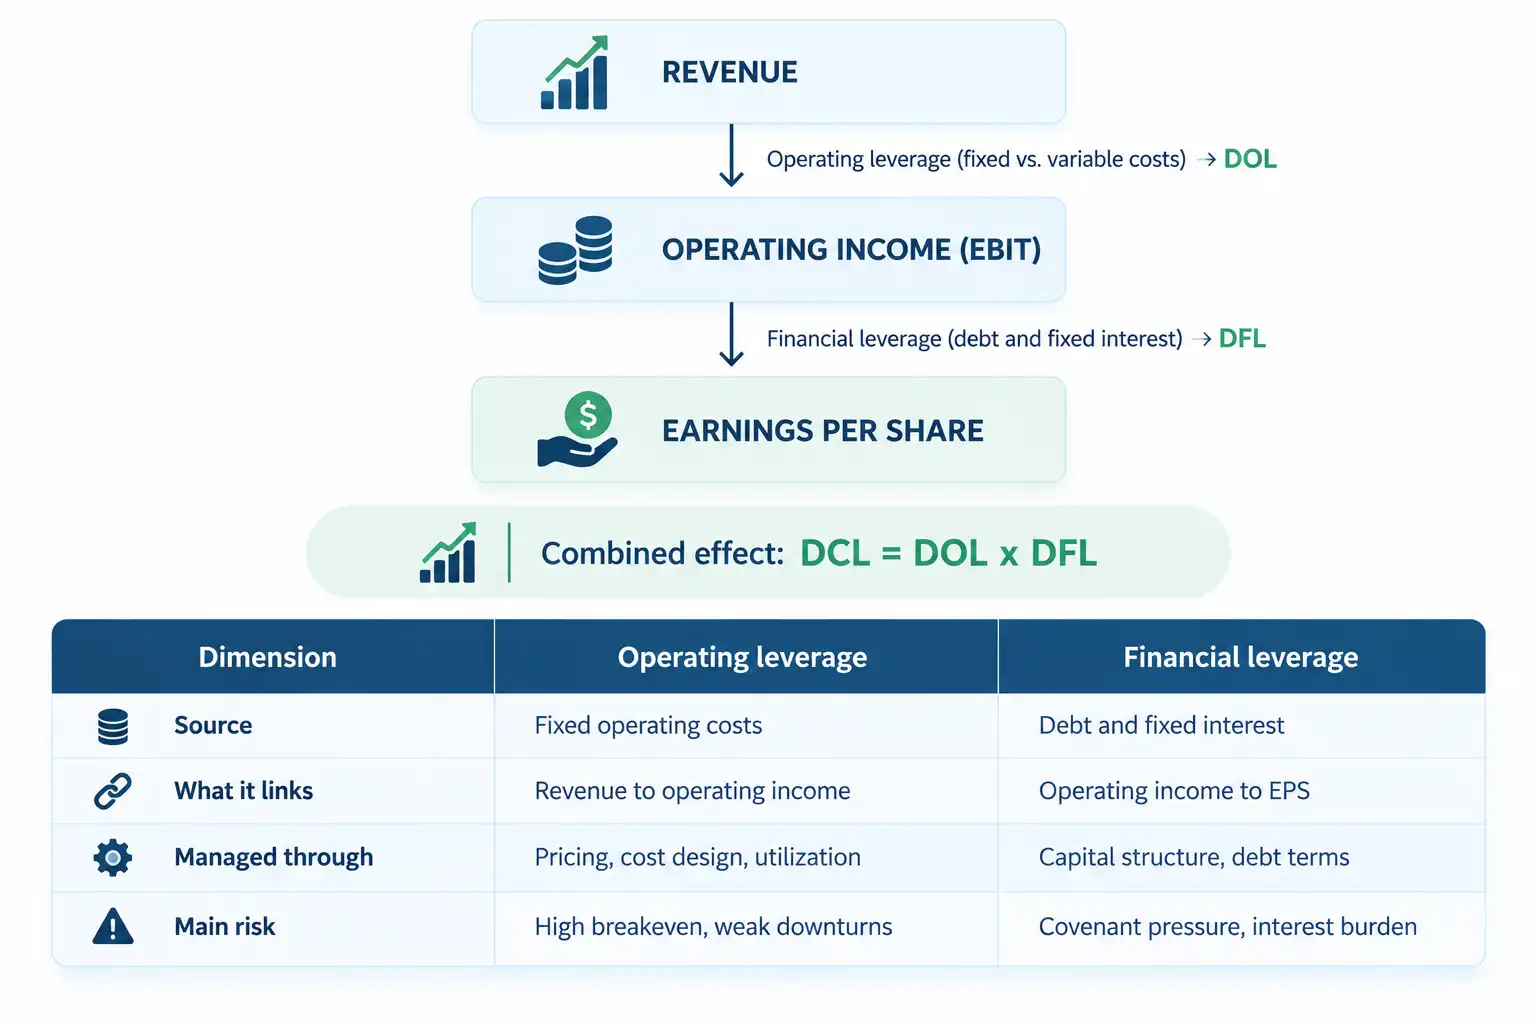
Operating and financial leverage act in sequence on the same income statement. The first governs how revenue converts into operating income. The second governs how operating income converts into earnings per share once debt and fixed interest are counted.
The Combined Effect on Earnings
The degree of financial leverage (DFL) equals the percentage change in earnings per share divided by the percentage change in operating income. Multiplying DOL by DFL gives the degree of combined leverage (DCL). A company with a DOL of 3.0 and a DFL of 1.5 has a DCL of 4.5, so a 10% revenue swing moves earnings per share by about 45%.
The gap between operating leverage and financial leverage matters most in downturns, when fixed costs and fixed interest stay in place while revenue falls. In a $127M global consumer products company carrying $12M in growth financing, the lender discussion and the operating plan drew on one model for this reason. Fixed warehouse and logistics commitments sat beside fixed interest obligations. A business with high operating leverage should generally carry less debt, and one with low leverage can support more.
How Business Models Embed Operating Leverage
Every business model encodes a cost behavior, and strategy works best when it respects that design.
| Model | Cost profile | Operating leverage | Strategic focus |
| Software and SaaS | High fixed R&D, low marginal cost | High after breakeven | Lifetime value, retention, value-based pricing |
| Professional services | Labor scales with revenue | Low | Utilization, pricing power, talent efficiency |
| Asset-heavy (manufacturing, logistics, hospitality) | High fixed facilities and equipment | High, with a high breakeven | Capacity utilization, demand generation, yield management |
| Retail and e-commerce | Mixed fixed and variable | Sensitive to volume | Channel efficiency, acquisition cost versus retention |
| Platforms and marketplaces | Fixed technology and trust costs | High once liquidity builds | Market depth, user experience, defensibility |
Software delivers gross margins of 70% to 90% once the platform is built, but it demands front-loaded investment, sticky customers, and pricing aligned with value. Professional services trade scalability for flexibility, so utilization matters more than fixed infrastructure.
Asset-heavy models depend on volume, because every idle room, truck, or plant erodes margin. In rail and transportation, freight networks create or destroy margin according to how well fixed infrastructure fills with variable throughput.
The leverage profile of a business can also change over time. Automation, outsourcing, and process redesign shift cost curves, and a services firm that codifies its intellectual property into digital tools can expand margin without adding headcount. Investor expectations should track the profile as well, since a high-growth SaaS business and a mature industrial firm warrant different profitability standards.
Operating Leverage and Capital Allocation
Capital deployed without regard for the leverage profile often buys growth that never converts into earnings. That profile changes the answer to nearly every allocation question:
- High operating leverage: Capital belongs in demand generation and monetization instead of more infrastructure, since idle capacity is a sunk cost.
- Low operating leverage: Yield matters more than scale, so capital should fund productivity tools, pricing power, and specialization.
- M&A: Acquisitions that absorb fixed costs, such as overlapping logistics networks, create upside only when integration is swift.
- Expansion: New markets or products should be tested for whether they add fixed costs that need volume or variable costs that preserve flexibility.
- Shareholder returns: High leverage with modest opportunities favors retained earnings, while low leverage with steady returns favors dividends or buybacks.
- Risk tolerance: Fixed-cost businesses need larger liquidity buffers and stronger scenario planning, while variable-cost businesses can take bolder swings.
Performance measurement should follow the same allocation logic. Incremental margin, the added profit from each added revenue dollar, works as a real-time gauge that rises when the business absorbs cost well. In a cybersecurity and identity SaaS company with about $30M in ARR, gross margin improved by 12% through pricing discipline, workforce composition, and delivery cost management. A driver-based forecasting engine also held actuals within 5% of forecast for 8 consecutive quarters.
From Operating Leverage to Enterprise Value
Investors reward efficient growth more than growth alone. A company expanding revenue by 15% annually with flat margins will double in five years, yet its valuation multiple may barely move. A company growing at the same pace with steady margin expansion doubles earnings faster and may earn a higher multiple as confidence in the durability of returns builds.
Leverage cuts both ways, since fixed costs remain when revenue declines, so high-leverage businesses need sensitivity analysis and scenario planning as safeguards. The strongest companies also convert fixed costs into variable ones through outsourcing, partnerships, or platform strategies, which adds flexibility and durability.
Culture sustains this discipline across teams. When marketing knows the breakeven acquisition cost and product understands how roadmap delays affect margin, alignment becomes operational. The most useful strategic plans work as leverage maps that state how a 20% revenue increase becomes a 30% increase in operating income, and which assumptions support that result.
Three Key Takeaways
- Operating leverage is a design choice embedded in the cost structure, and it can be measured through DOL, contribution margin, and incremental margin before growth plans are approved.
- Operating and financial leverage multiply each other, so the debt a company carries should reflect how fixed its operating cost base already is.
- Capital allocation, business model, and valuation all follow the leverage profile, which means the strongest growth plans tie revenue targets directly to margin expectations.
Disclaimer: This article is intended for informational purposes only and does not constitute legal, tax, or accounting advice. You should consult your own tax advisor or counsel for advice tailored to your specific situation.
Hindol Datta is a four-time CFO and senior finance executive with over 25 years of leadership experience across cybersecurity, SaaS, gaming, logistics, digital marketing, medical devices, consumer products, and nonprofit organizations. He has led more than $120M in fundraising and over $150M in M&A transactions while building the financial and operational systems that let complex businesses scale with confidence. He is the author of seven books in the Systems CFO Series and holds active CPA, CMA, and CIA credentials.
AI-assisted insights, supplemented by 25 years of finance leadership experience.