
Executive Summary
Operating leverage is the quiet force that decides whether growth turns into value or merely into size. With fixed costs designed on purpose, each new dollar of revenue carries more profit downward. Investors reward that structure with richer valuation multiples.
This article explains what operating leverage is and works through the operating leverage formula with a numeric example. It then covers the governance pressures, the failure modes, and a framework for cost structures that compound value.
What Is Operating Leverage and Why It Shapes Valuation
Conventional finance training treats fixed costs as a hazard, framing them as cliffs that sharpen every downturn. The resulting instinct is to keep the cost base variable. That instinct protects the downside, yet it often caps the upside as well.
Operating leverage describes how a change in revenue produces a larger percentage change in operating income. The amplifier is the share of costs that stays fixed as volume moves. A business with heavy fixed costs converts new sales into profit far faster than one adding cost per unit.
Leverage never arrives in hindsight, because it lives in design decisions made long before revenue arrives. Platforms, delivery models, supply contracts, and overhead bandwidth all carry it. Once embedded, it binds the ratio between effort and result for years.
Real Leverage Versus Overhead Disguised as Investment
Some fixed costs create leverage, while others simply sit on the books. A SaaS business can show high gross margin and low churn while carrying quasi-fixed costs that drift. Customer success grows with every account, engineering rearchitects without end, and G&A scales on instinct. The model promises margin expansion that the P&L never delivers, and valuation suffers.
The Operating Leverage Formula, Explained
The standard measure is the degree of operating leverage, or DOL. Two equivalent versions of the operating leverage formula appear in practice, and both rest on contribution margin.
- DOL = % change in operating income (EBIT) ÷ % change in revenue
- DOL = contribution margin ÷ operating income
- Contribution margin = revenue minus variable costs
A DOL of 3.0 means a 10% rise in revenue lifts operating income by 30%. The same multiplier works in reverse, which is the part rarely shown on a board slide.
Worked Example: Same Revenue, Different Cost Structures
Two companies each earn $10M in revenue and $2M in operating income today. Company A runs lean on fixed costs, while Company B has invested ahead of scale.
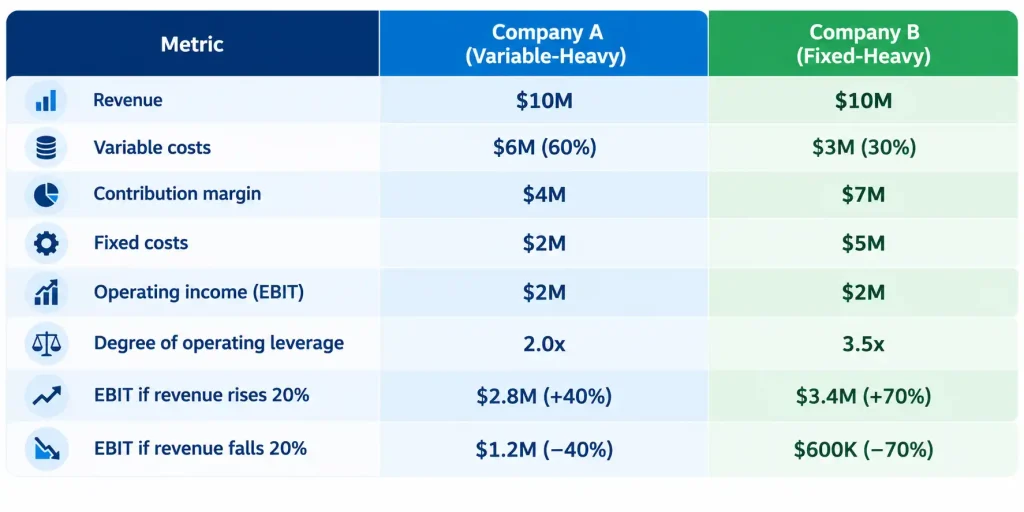
Company B wins decisively when volume grows and suffers twice as hard when it shrinks. That symmetry is the entire story of operating leverage compressed into one table.
Building Operating Leverage Before Scale Arrives
True scale means doing more without spending proportionally more. This is less cost control than cost sequencing, the laying of track before the train arrives.
Lean models with elastic staffing often produce a beautiful P&L and a fragile company. Strength looks like inefficiency at first, because deliberate pre-capacity resembles bloat until revenue rises.
A venture-backed digital marketing company that scaled from $9M to $180M in 24 months shows the opposite path. Its finance function and CAC, LTV, and contribution margin discipline existed ahead of volume. The structure absorbed growth instead of chasing it. Manufacturers moving from bespoke production to modular assembly follow the same arc, with margin climbing by year three.
Testing Whether a Cost Will Scale
Each cost center deserves a direct elasticity test before it qualifies as a source of leverage.
- Can existing structure absorb the next unit of output without replicating cost?
- Does the function grow linearly with accounts, products, or headcount?
- Where is the bottleneck that will force the next step-change in spending?
The Operating Leverage Lifecycle
| Stage | What Happens | Finance Priority |
| Invest | Fixed capacity built ahead of demand | Sequence spending against credible milestones |
| Scale | Revenue fills existing capacity | Track declining marginal cost per unit |
| Reap | Margins expand faster than revenue | Protect discipline and avoid premature spending |
| Reinvest | Capacity saturates and gains flatten | Recalibrate the model before structure becomes constraint |
Conviction, Culture, and Board Governance
Leverage builds quietly, like tectonic stress, and the waiting becomes its own test of faith. Before it delivers, every decision to hire ahead of revenue makes leadership look reckless. Culture reveals its instincts under that pressure, either retreating or shouldering the load.
Conviction still differs from stubbornness, and the difference shows when results lag. Building enterprise sales infrastructure before product-market fit, then adding headcount as revenue stalls, is sunk cost fallacy dressed as courage. The finance leader must be the truth-teller who can say the bet came too early.
Boards add another layer of tension to the leverage decision. Many want the margin expansion leverage promises without the volatility it requires. The CFO has to explain that burn in Year Two enables operating margin in Year Five. In one private equity debate over a shared analytics platform, the short-term IRR looked invisible, yet portfolio EBITDA rose within three years.
Reading the Metrics That Reveal Operating Leverage
Operating leverage does not shout from the top line; it murmurs from the middle of the P&L. The core question is always marginal: what does it cost to serve one more customer or ship one more unit? If that cost declines as output scales, leverage is present.
Contribution Margin and Valuation Multiples
Contribution margin delta, the share of incremental revenue that becomes gross profit, is the clearest signal. Consider two software companies, each growing 30% a year. Company A carries a 35% contribution margin and Company B carries 60%. Investors assign B the higher multiple because more of its growth reaches cash flow.
Genuine leverage reshapes the ratios that capital markets watch:
- CAC payback shortens and LTV/CAC expands
- Gross margin climbs without price increases
- Operating cash flow margin rises, which matters more than adjusted EBITDA
Separating Real Leverage from Illusion
| Genuine Operating Leverage | Manufactured Leverage |
| Marginal cost declines as volume grows | Costs capitalized that should be expensed |
| Retention-adjusted margins improve | Hiring delayed to inflate short-term margin |
| Strength shows up in the second sale | Revenue pulled forward while churn hides |
A professional services firm that scaled from $12M to $63M in eight months illustrates the stakes. New engagement-level profitability analytics across five business units exposed where margin grew and where it leaked. Every review needs a simple stress test: if revenue doubled tomorrow, what would break first?
When Operating Leverage Reverses
The same asymmetry that multiplies profit also multiplies loss. A digital media company invested heavily in studios, automation, and senior talent ahead of scale. Then user acquisition plateaued and advertiser budgets shifted. Its costs remained, and the structure built for flight held it to the ground.
Fixed costs rarely scream; they hum, and that quiet lulls leaders into delay. A lease cannot shrink by half, and a platform cannot unwind without operational chaos. Broad severance amounts to deferred regret with a check attached.
In an early-stage email marketing company, a turnaround cut monthly burn from $800K to $200K. The cost base was rebuilt around what revenue could support. Recovery from reversed leverage tends to rest on three lessons:
- Precision: not all growth warrants leverage, and a spike in sales is not a forecast.
- Contingency: every leverage plan needs unwinding logic for a forecast miss of 20% or 40%.
- Humility: failure often stems from loving the model more than testing it.
A logistics business that misread the shift toward third-party delivery rebuilt with a smaller core and strategic partners. When it grew again, leverage followed growth instead of preceding it.
Designing Operating Leverage as Strategic Optionality
Great cathedrals survive centuries because their arches distribute stress, and strong cost structures work the same way. The art lies in making the structure intelligent, with modularity and deferral built in.
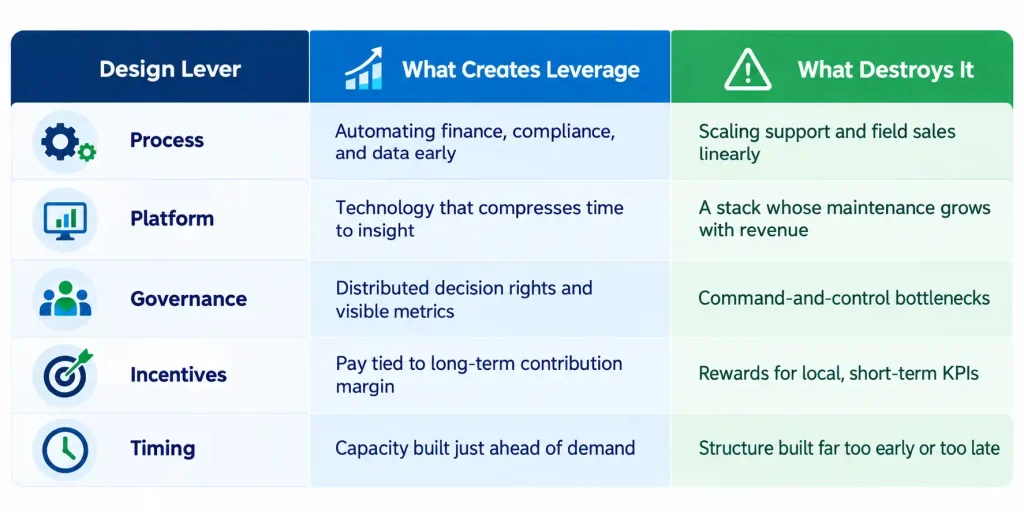
A cybersecurity company with $30M in ARR showed modular design in practice. Balancing employees against subcontractors kept bench utilization under 5% to 7% during rapid growth.
Narrative carries the finished design into the capital markets. Before an IPO, bankers respond to proof that gross margin can expand without new hires. Valuation then rests on structure instead of charisma, and the business earns the freedom to choose its future.
Three Key Takeaways
- Operating leverage is a design choice made before revenue arrives, and the operating leverage formula shows that it amplifies losses as forcefully as gains.
- Contribution margin delta, declining marginal cost, and retention-adjusted margins reveal whether leverage is genuine or manufactured through accounting choices.
- The most valuable cost structures pair fixed investment with modular capacity and unwinding logic, so the business can scale when demand arrives and adapt when it does not.
Disclaimer: This article is intended for informational purposes only and does not constitute legal, tax, or accounting advice. You should consult your own tax advisor or counsel for advice tailored to your specific situation.
Hindol Datta is a four-time CFO and senior finance executive with over 25 years of leadership experience across cybersecurity, SaaS, gaming, logistics, digital marketing, medical devices, consumer products, and nonprofit organizations. He has led more than $120M in fundraising and over $150M in M&A transactions while building the financial and operational systems that let complex businesses scale with confidence. He is the author of seven books in the Systems CFO Series and holds active CPA, CMA, and CIA credentials.
AI-assisted insights, supplemented by 25 years of finance leadership experience.