
Executive Summary
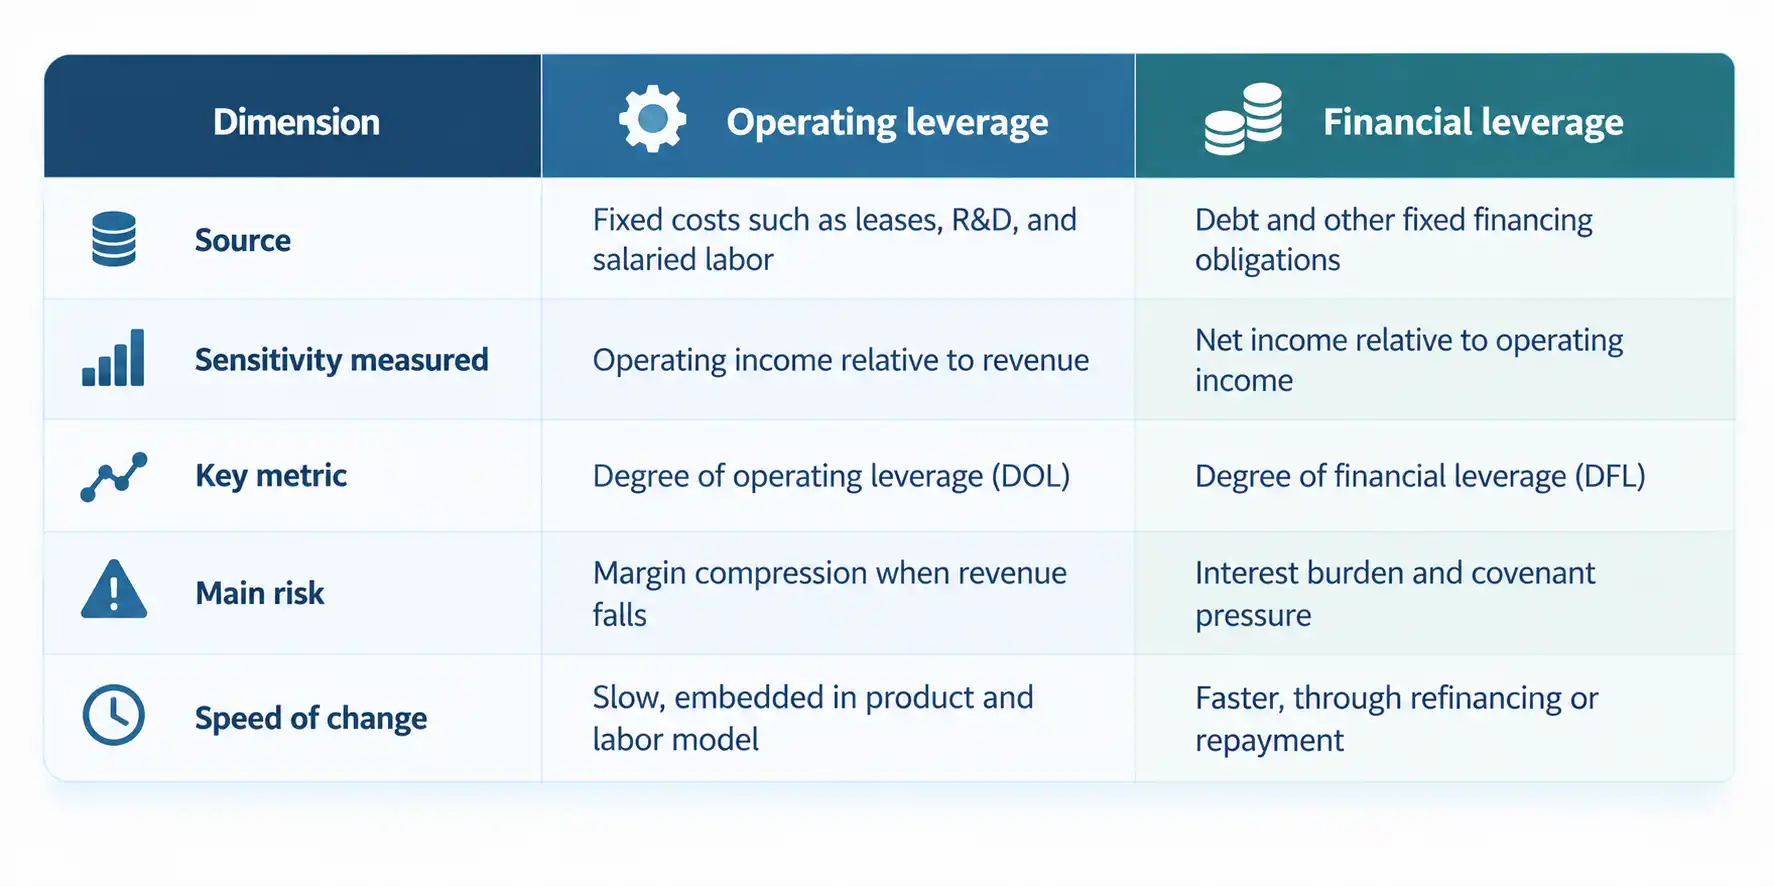
Operating leverage and financial leverage both magnify results, yet they act on different lines of the financial statements. The first governs how revenue converts into operating income, while the second governs how operating income converts into net income.
Understanding operating leverage vs financial leverage, and how the two compound, lets finance leaders set cost structure and capital structure together. This article defines each form, shows how to measure them, and outlines governance that protects returns when revenue turns.
Operating Leverage vs Financial Leverage: Two Different Risks
Many executives treat leverage as a single dial that raises returns when turned up. Two dials operate at once, and each is set by a different decision. Cost structure sets the first, and capital structure sets the second.
What Operating Leverage Measures
Operating leverage reflects how fixed and variable costs behave as revenue scales. Once fixed costs are covered, each added dollar of revenue drops largely into profit. Software and platform businesses expand margins quickly after breakeven for this reason, although the same structure produces sharper losses when revenue contracts.
What Financial Leverage Measures
Financial leverage arises when borrowed capital funds operations or growth. Debt lifts equity returns when the business earns more than it pays to borrow, and tax-deductible interest lowers the cost further. Interest is owed regardless of results, so debt places a fixed obligation on an uncertain revenue stream.
Measuring Operating Leverage and Financial Leverage
Five metrics give a working picture of both forms of leverage:
- Degree of operating leverage (DOL): the percentage change in operating income divided by the percentage change in sales. A ratio above one shows profit growing faster than revenue.
- Degree of financial leverage (DFL): operating income divided by operating income less interest expense, which shows how sharply net income responds to operating profit.
- Interest coverage ratio: operating income divided by interest expense, which shows how much room exists before lenders tighten terms.
- Debt-to-EBITDA: the number of years of earnings required to retire existing debt.
- Debt-to-equity ratio: the balance between lender funding and shareholder funding.
DOL is more reliable when measured across several periods. Temporary cost actions or one-off revenue can distort a single quarter, so the metric should capture structural cost behavior.
Operating Leverage in Practice: Fixed Costs, Variable Costs, and Mix
Operating leverage is designed, not discovered, since decisions on insourcing, automation, pricing, and customer mix all shift the ratio of fixed to variable cost. Early-stage companies often begin with contractors and third-party services, then build infrastructure that trades flexibility for control and margin potential.
Early FP&A work on rail and transportation operations showed how fixed infrastructure and variable throughput decide whether a network creates or destroys margin at the unit level. In an early-stage email marketing technology company, a turnaround that cut monthly burn from $800K to $200K showed how quickly a rigid cost base becomes a survival question. In a cybersecurity SaaS company with roughly $30M in ARR, careful management of the employee and subcontractor mix held bench utilization under 5% to 7% during rapid growth.
A sound operating leverage analysis models the following items:
- Breakeven points and contribution margin by product and customer segment
- Step costs, such as a new facility or a new tier of headcount
- Cost behavior under a revenue shortfall of 10% to 25%
- The effect of discounting on contribution margin
Financial Leverage in Practice: Capital Structure as a Strategic Instrument
A company that earns 12% on capital and borrows at 5% lifts equity returns through the spread. Recurring revenue, strong retention, and low capital intensity support more debt. Cyclical demand, volatile cash flows, and limited pricing power support less, so the capacity to carry debt matters more than access to it.
Debt Structure, Covenants, and Flexibility
Short-term debt raises refinancing risk, while long-term fixed-rate debt brings stability at the cost of flexibility, and revolving lines add flexibility with tighter covenants. Structure should follow the rhythm of the business, so seasonal companies match debt service to cash peaks.
Covenants can force a company to defer investment or sell assets in a weak market, which makes covenant flexibility worth a slightly higher interest rate. In a $127M global consumer products company, securing $12M in growth financing while lifting inventory turns from 3x to 7x showed that working capital discipline expands debt capacity. Raising $37M across equity and venture debt for a mission-driven education institution required weighing dilution against the rigidity of fixed repayments.
Total Leverage: How Operating Leverage and Financial Leverage Compound
The two forms of leverage act in sequence, and their effects multiply instead of adding together.
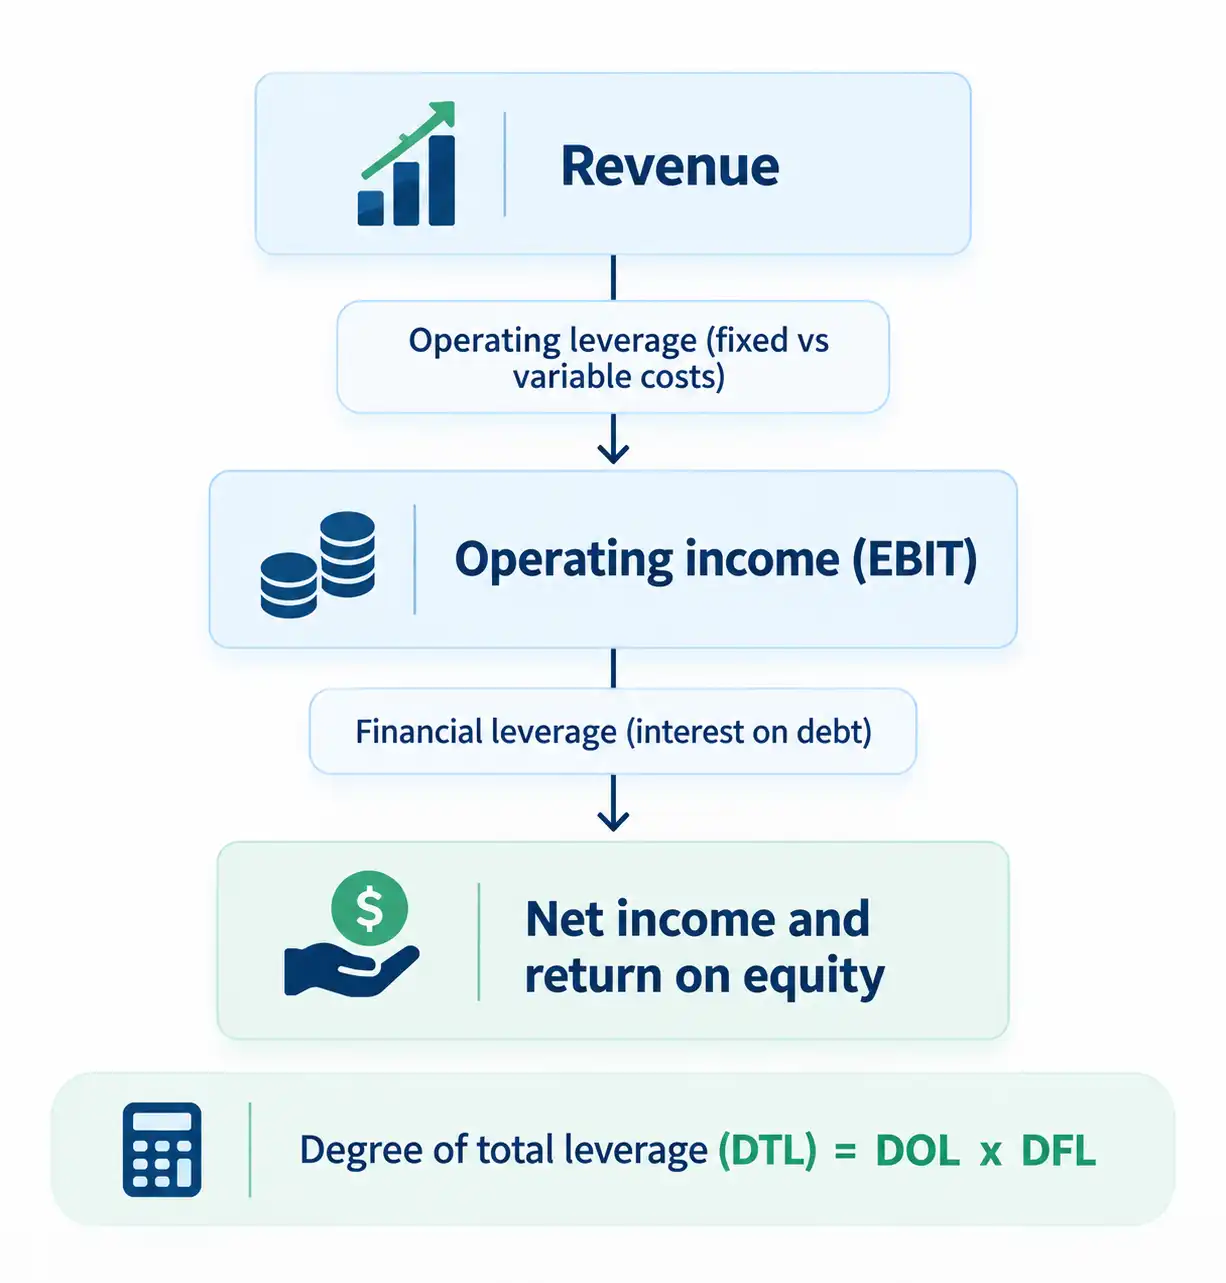
A company with $100M in revenue, 40% variable costs, $45M in fixed costs, and $5M in interest has operating income of $15M, a DOL of 4.0, a DFL of 1.5, and a DTL of 6.0. A 10% change in revenue therefore moves pre-tax income by 60%.
| Scenario | Revenue | Operating income | Pre-tax income |
| Revenue down 10% | $90M | $9M (-40%) | $4M (-60%) |
| Base case | $100M | $15M | $10M |
| Revenue up 10% | $110M | $21M (+40%) | $16M (+60%) |
Leverage Symmetry and Capital Deployment
Firms with high operating leverage, such as software companies, should generally carry lower financial leverage. Firms with variable cost models, such as staffing agencies, can carry more debt with less margin risk. Operating leverage is also harder to unwind, since debt can be refinanced while a bloated cost base lingers.
The 2008 financial crisis and the 2020 pandemic showed that total leverage is the true risk indicator. Firms with balanced profiles had room to renegotiate, while double-exposed competitors struggled. The same logic applies to capital deployment, where a debt-funded plant raises both forms of leverage and a simple payback model may look acceptable until a 10% revenue shortfall turns equity returns negative. Scenario analysis should therefore model net income sensitivity, not only EBITDA uplift.
Governing Operating Leverage and Financial Leverage Across Cycles
Companies often lock in cost and capital decisions during optimistic periods. Effective governance treats both forms of leverage as strategic variables reviewed at executive and board level:
- Dynamic thresholds: set debt-to-EBITDA bands that widen during expansion and tighten before a known downturn.
- Stress tests: model a 25% revenue decline, the speed of cost reduction, and which covenants become exposed.
- Cash governance: maintain weekly or monthly rolling cash forecasts, since financial leverage expresses its risk through working capital.
- Cross-functional ownership: align sales on pricing, operations on committed versus flexible cost, HR on workforce strategy, and legal and treasury on covenant language.
- Risk-adjusted returns: read return on invested capital alongside leverage metrics to see whether value creation and volatility are rising together.
- Investor communication: explain why the debt profile fits the predictability of revenue.
Forecast discipline supports every item on that list. In the cybersecurity SaaS company, a driver-based forecasting engine held actuals within plus or minus 5% of forecast for 8 consecutive quarters. That predictability made leverage decisions easier to defend at board level.
Governance must also be iterative, because margins shift and a balance sheet that once supported moderate debt can become over-leveraged. The board should keep asking whether the leverage profile fits the market for the next decade, not only the next quarter.
Three Key Takeaways
- Treat operating leverage vs financial leverage as two decisions about cost structure and capital structure, and evaluate them together through total leverage, where DTL equals DOL multiplied by DFL.
- Calibrate leverage to revenue volatility and cost elasticity, pairing high operating leverage with modest debt and reserving heavier borrowing for businesses with recurring, predictable revenue.
- Govern leverage through stress tests, cyclical thresholds, rolling cash forecasts, and cross-functional ownership, so that assumptions are revisited before the market forces the question.
Disclaimer: This article is intended for informational purposes only and does not constitute legal, tax, or accounting advice. You should consult your own tax advisor or counsel for advice tailored to your specific situation.
Hindol Datta is a four-time CFO and senior finance executive with over 25 years of leadership experience across cybersecurity, SaaS, gaming, logistics, digital marketing, medical devices, consumer products, and nonprofit organizations. He has led more than $120M in fundraising and over $150M in M&A transactions while building the financial and operational systems that let complex businesses scale with confidence. He is the author of seven books in the Systems CFO Series and holds active CPA, CMA, and CIA credentials.
AI-assisted insights, supplemented by 25 years of finance leadership experience.