
Executive Summary
Metrics ownership is the invisible infrastructure that separates companies that scale gracefully from those that stall under their own growth. When finance treats numbers as shared instruments rather than departmental judgments, non-finance leaders begin to argue for the metrics that matter, not merely report on them. This shift rarely happens through mandate. It grows through translation, co-creation, and consistent dialogue between finance and the teams closest to the work. Drawing on more than twenty-five years of finance leadership, spanning sectors as varied as SaaS, cybersecurity, gaming, logistics, and digital marketing, a clear pattern emerges. CFOs can move beyond dashboards and scorecards to build genuine business metrics fluency across an organization. Once established, that fluency becomes the quiet engine behind sustainable growth.
Why Metrics Ownership Defines High-Growth Companies
Every finance leader eventually meets the same wall. A product leader questions the logic behind a feature-level return calculation. A marketing team doubts whether an attribution model reflects its true contribution. An engineering leader treats a schedule overrun as an inevitability rather than a cost. None of this stems from a lack of capability. It stems from a lack of ownership, and ownership is the true subject of metrics ownership as a discipline.
In organizations moving from Series A through Series D, roles evolve week to week and the pace rarely slows. Having led finance transformations across cybersecurity, SaaS, gaming, logistics, digital marketing, medical devices, and nonprofit organizations, I have observed a consistent pattern. Companies that scale well are the ones where every functional leader treats KPI ownership as a lever within their own control, not a report card issued by finance.
Reaching that point requires finance to build a bridge of language. Charts that look precise but leave an audience cold rarely change behavior. A sales leader who cannot explain her contribution margin cannot improve it. A product manager who cannot connect roadmap investment to customer lifetime value will invest in what is elegant rather than what is necessary. The task for finance is not to simplify the model. It is to raise the altitude of the conversation so that business metrics become common language rather than specialized vocabulary.
From Resistance to Co-Creation
Early resistance to structured KPI frameworks is common, and I have encountered it often, including with a product leader who initially found scorecards rigid and reductionist. Rather than impose a framework, we co-created one. We began with a small set of meaningful indicators: usage frequency, retention curve velocity, and feature level satisfaction. We built a dashboard that answered her questions before it answered mine. Within two quarters she was leading quarterly reviews built around metrics that felt alive rather than imposed.
This pattern repeats across sectors. During my time scaling a digital marketing organization from nine million to one hundred and eighty million dollars in revenue, the turning point was never a new reporting tool. It was the moment functional leaders began asking for deeper metrics rather than merely accepting the ones finance supplied.
Borrowing From Established Frameworks Without Being Bound by Them
Frameworks such as Objectives and Key Results offer useful structure, though in practice they can become quarterly rituals with little consequence if not embedded into daily operating rhythm. I prefer to tie each function’s objectives to the levers its people touch every day. Engineering might own deployment velocity and defect rate. Marketing might own lead quality index and funnel throughput. Customer success might own expansion revenue per manager. The common thread is immediacy. A metric that reflects action within a sprint or a week feels personal. A quarterly abstraction never does.
The Balanced Scorecard tradition also offers a valuable lesson in multidimensionality. It insists that learning, process, customer, and financial perspectives be weighed together rather than in isolation. This aligns closely with systems thinking, an orientation I have relied on throughout finance transformations spanning global organizations. Customer satisfaction influences referrals, referrals influence pipeline efficiency, pipeline efficiency influences acquisition cost, and acquisition cost influences cash burn. A single indicator rarely tells the whole story, and the discipline lies not in choosing the framework but in applying it with rigor.
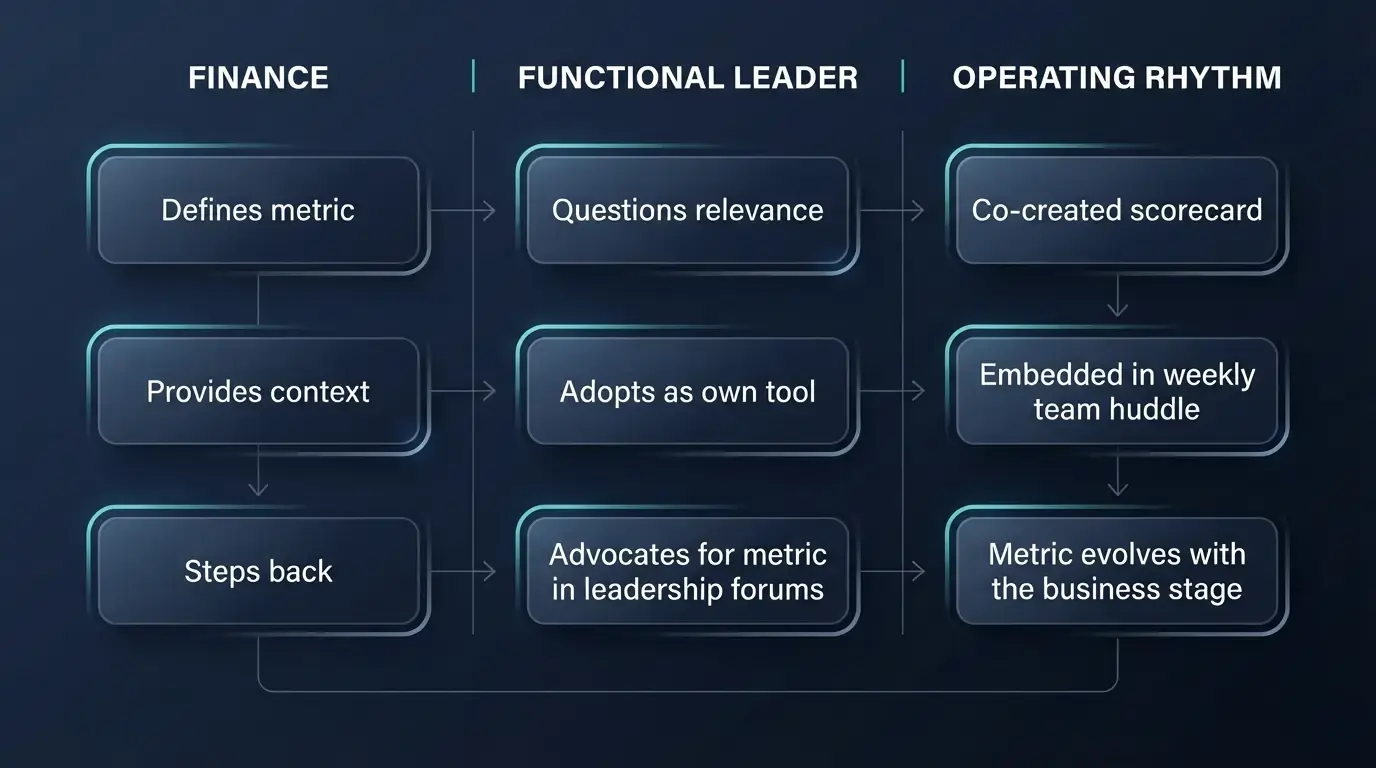
A Diagram of Ownership in Motion
The following diagram illustrates how metrics ownership typically moves from finance stewardship toward genuine cross functional advocacy.
Building Enablement, Not Just Reporting
Reducing monthly cash burn from eight hundred thousand dollars to two hundred thousand dollars at one organization taught me something important. Finance enablement must extend well beyond a monthly close calendar. Non-finance leaders need to understand how product design affects gross margin. They need to see how compensation plans shape sales behavior. Pricing architecture influences churn in ways that are rarely obvious. Billing cadence, too, changes visibility into cash in ways every leader should grasp. These are not abstract lessons. In one workshop with engineering leaders, we modeled how a two week delay in feature delivery deferred two hundred thousand dollars in recognized revenue. That single exercise changed how the team approached sprint planning. Finance stopped being a reporting function. It became part of the execution toolkit.
Enablement also depends on tools that prioritize interpretability over aesthetics. Every metric should carry its own context. It should show what it measures, why it matters, how often it updates, and who is accountable for it. When the logic behind a number is visible and open to challenge, teams trust the output. When they trust the output, they use it.
- Attribution logic should be documented and available for scrutiny, not buried in a spreadsheet formula
- Scorecards should reflect trade offs rather than only targets
- Metrics should be retired and replaced as a business matures, from adoption to engagement to monetization
Culture Is the Most Stubborn Frontier
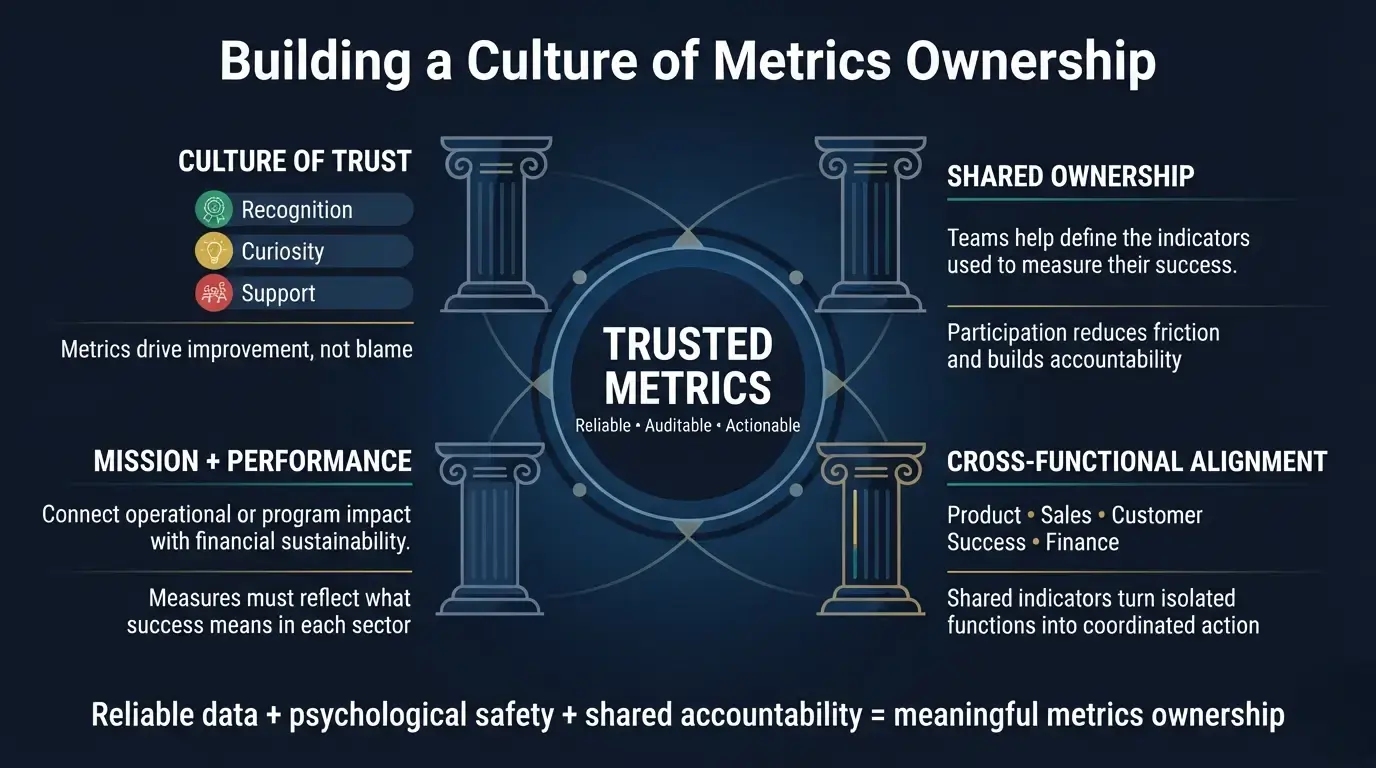
Even with strong tools and training, metrics ownership does not flourish in an environment governed by fear. Leaders need room to explore, to miss a target, and to iterate without punitive consequence. At one organization, we implemented a red, yellow, and green system across strategic indicators, but inverted the usual emotional weight attached to each color. Green received recognition. Yellow received curiosity. Red received support. Underperformance became an invitation to collaborate rather than a trigger for blame, and teams began to own their metrics because they experienced them as instruments of improvement rather than judgment.
Having overseen more than one hundred million dollars in gaming sector acquisitions, I have seen how quickly metrics ownership can either accelerate or stall an integration. When acquired teams are invited to help define the indicators that will measure their own success, integration proceeds with far less friction than when metrics arrive as a mandate from a new parent organization.
Metrics Ownership in Regulated and Mission Driven Sectors
The discipline of metrics ownership changes shape depending on the sector, though its underlying purpose remains constant. In medical devices, where regulatory scrutiny and quality assurance sit alongside commercial performance, finance must help teams see how a delay in regulatory clearance affects not only launch timing but also working capital planning. Credentials such as CPIM and PMP have been useful in these environments, since they give finance a shared vocabulary with operations and program leaders who think in terms of process control and milestone dependencies rather than pure financial output.
Nonprofit and mission driven organizations present a different challenge entirely. Here, metrics ownership must reconcile financial sustainability with programmatic impact, and a scorecard built solely around margin will feel foreign to a team measuring lives touched or students served. During the forty eight million dollar capital raise at a mission driven education institution mentioned earlier, the most persuasive metrics were the ones that connected enrollment growth and program outcomes directly to the institution’s long term financial resilience. Donors and lenders alike responded to a narrative where mission and margin moved together rather than in tension.
Across both regulated and mission driven contexts, the CMA and CIA disciplines have shaped how I think about internal control and assurance around the numbers themselves. A metric that non-finance leaders can trust only holds that trust if the underlying data pipeline is sound. Before asking a product or program leader to own a number, finance has an obligation to ensure that the number itself is reliable, auditable, and free from the kind of quiet manual adjustment that erodes confidence the moment it is discovered. Metrics ownership, in other words, is built on a foundation of data integrity that finance must guarantee before it can reasonably ask anyone else to take responsibility for what the numbers say.
Harmonizing Attribution Across Functions
Revenue rarely belongs to a single function. Product design, onboarding experience, and billing reliability all shape net retention alongside sales performance. In one engagement, we discovered that a significant share of churn occurred in accounts where onboarding extended beyond thirty days. The cause was not poor customer support but a mismatch between sales promises and product readiness. Once this became visible across departments, engineering prioritized onboarding improvements, sales adjusted its pitch, and customer success introduced earlier interventions. A single indicator, made visible, created coherence across three functions that had previously worked in parallel rather than in concert.
Metrics as Boundary Conditions, Not Local Truths
Systems thinking treats every function as a node within a larger system, where metrics act as boundary conditions connecting cause and effect across departmental lines. Local optimization within one function can quietly produce inefficiency elsewhere, which is why scorecards benefit from including indicators that sit between functions, such as product marketing conversion rate or expansion revenue by original sales segment. These shared metrics have more than one owner, and that shared ownership forces the kind of conversation that a purely departmental metric never invites.
This principle proved essential during a forty eight million dollar capital raise for a mission driven education institution, where finance needed to translate operational metrics into a narrative that investors, faculty, and administrators could all recognize as their own. The capital raise succeeded not because the underlying numbers were unusually strong, but because every stakeholder could see their own contribution reflected within them.
Ownership also depends on accessibility. Metrics that remain locked inside finance decks rarely inspire action, while metrics embedded in team dashboards, reviewed in weekly huddles, and linked to broader objectives tend to travel further into daily decision making. Having led capital raises exceeding one hundred and twenty million dollars and M&A transactions exceeding one hundred and fifty million dollars, I have found that investors and boards respond most favorably when they sense that metrics ownership runs through the organization rather than resting solely with finance.
Conclusion
Metrics ownership is not a reporting exercise. It is a leadership discipline. It determines whether a company runs on hope or on feedback. Across sectors as different as cybersecurity, SaaS, gaming, logistics, digital marketing, medical devices, and nonprofit work, the pattern holds consistently. Companies that scale well are those where finance steps back from being the sole guardian of numbers. Finance instead becomes the enabler of number fluency across every function. That shift requires humility. Finance owns a lens rather than the truth itself, and that lens must remain open to challenge as the business changes shape. When leaders begin to advocate for the indicators that describe their own contribution, strategy execution accelerates on its own. The company no longer waits for finance to explain what happened. It moves forward guided by shared clarity, one of the most durable advantages a growing organization can build.
Disclaimer: This blog is intended for informational purposes only and does not constitute legal, tax, or accounting advice. You should consult your own tax advisor or counsel for advice tailored to your specific situation.
Hindol Datta is a seasoned finance executive with over 25 years of leadership experience across SaaS, cybersecurity, logistics, and digital marketing industries. He has served as CFO and VP of Finance in both public and private companies, leading $120M+ in fundraising and $150M+ in M&A transactions while driving predictive analytics and ERP transformations. Known for blending strategic foresight with operational discipline, he builds high-performing global finance organizations that enable scalable growth and data-driven decision-making.
AI-assisted insights, supplemented by 25 years of finance leadership experience.