
Executive Summary
A sound market penetration strategy begins with a simple recognition: visibility is not victory. Growth without depth amounts to drift, not genuine progress. Finance sits where sales ambition meets economic reality. That position makes the CFO the natural steward of how deeply a company embeds itself in its chosen markets.
This article separates presence from penetration and examines the customer acquisition cost and lifetime value metrics that govern expansion. Retention curves, cohort analysis, and sales productivity then show whether growth is compounding or quietly eroding. It closes with the role of the CFO in turning those numbers into dialogue that changes decisions.
Market Presence Versus Market Penetration in Growth Strategy
Presence is visibility: the logo at the trade show and the product on the shelf. Penetration is depth, the degree to which a solution embeds itself in customer spending, decisions, and routines. Marketing largely drives presence, whereas value drives penetration. Any market penetration strategy that confuses the two will produce impressive activity with disappointing economics.
A new segment often looks like a triumph in its first months. Marquee trials, warm testimonials, and a handful of early deals all point toward success. Six months later, the numbers frequently tell another story. Average revenue per user runs low, retention looks fragile, and support costs sit well above plan. Three questions separate genuine penetration from early excitement. Did customers buy the product as a pilot or as a platform? Does it solve a core problem or a peripheral one? Are renewals, usage, and margins improving over time?
Segmentation and Pricing Discipline for Market Expansion
Every credible strategy for market expansion starts with segmentation. Segments do not yield equal strategic value, and counting logos hides the difference. Finance can show which customers are profitable and which segments tolerate price increases. It can also identify the cohorts that keep renewing under stress. Overlaying those findings on sales patterns reveals where to double down and where enthusiasm clouds judgment.
Pricing belongs in the same conversation. A low price opens doors, yet it also obscures value. Companies that underprice themselves into irrelevance still win deals. In doing so, they surrender the margin, credibility, and stickiness they hoped to build. The finance argument favors the truest price over the highest one, a price that reflects consequence as well as cost.
Absorption Capacity as an Economic Guardrail
Absorption capacity asks how quickly an organization can digest new customers without degrading the experience they receive. Support volume, onboarding scalability, and delivery capacity are economic guardrails, not operational trivia. The worst growth is the kind that hollows a company out from within. Finance therefore serves best when it disciplines the plan at the design stage, modeling bottom-line consequences alongside top-line upside.
Customer Acquisition Cost and Lifetime Value in a Market Penetration Strategy
Customer acquisition cost reflects how much conviction a company holds in its ability to turn awareness into loyalty. Lifetime value is the economic biography of a customer, showing how deeply they engage and how consistently they return. The two metrics live in tension with each other. That tension shows whether a market penetration strategy is compounding value or eroding it.
Consider a venture-backed performance marketing company that scaled revenue from $9M to $180M in 24 months. Sustaining that pace required CAC, LTV, and contribution margin analytics embedded in every growth decision, because the early pipeline numbers alone would have flattered segments that were lower-margin, higher-churn, and costlier to serve than planned. The product was sound in those segments, but the fit was off, and finance caught the gap through discipline rather than dashboards.
Reading the LTV to CAC Ratio Honestly
Boardrooms repeat the three-to-one benchmark like gospel, yet the ratio tells a contextual story, not a universal truth. What matters is the composition beneath the headline number. The useful diagnostic questions include the following.
- Is LTV supported by renewal behavior or by one-time spikes?
- Are upsells built into the sales motion or dependent on individual heroics?
- Does CAC stay stable, or does it climb as channels saturate?
- Does CAC include sales compensation, onboarding cost, and the opportunity cost of internal resources?
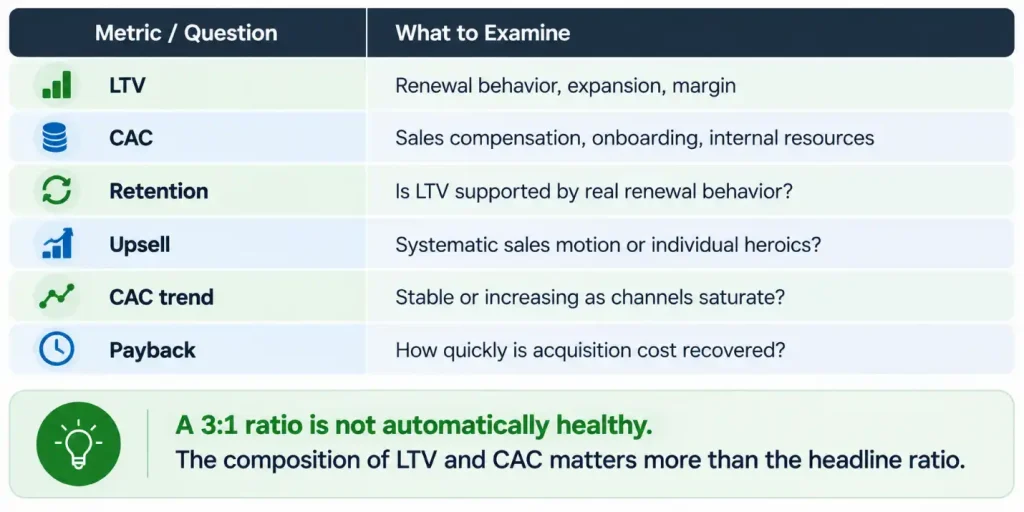
LTV deserves the same scrutiny as a composite of retention, expansion, and margin. Models that assume smooth retention and frictionless upsells inflate the figure. Real customers churn without warning, pause spend, and demand that vendors win them again and again, so conservative assumptions signal risk awareness, not risk aversion.
Payback Period and the Cost of Waiting
CAC is incurred upfront while LTV arrives over time, and that mismatch creates a temporal risk which the payback period captures. Payback is the months required to recover acquisition cost from gross margin, and in volatile markets it decides survivability, since believing a customer will eventually be profitable is different from being able to afford the wait. When CAC swells and payback lengthens, the pressure to scale faster becomes a threat, and the disciplined response is to slow the wheel out of fidelity to the long term.
An early-stage email marketing technology company illustrates the stakes, having cut monthly burn from $800K to $200K only after acquisition and spending decisions were tied to what the business could actually sustain.
Retention Curves, Cohort Analysis, and Sales Productivity
True penetration shows itself less in the initial slope of growth than in the decay rate of churn, in the months after signing when excitement fades and value must stand alone. Measuring retention too early mistakes initial engagement for embeddedness, which is why cohort analysis remains one of the most underused lenses in any market penetration strategy.
Cohort Profitability and Quiet Erosion
Layering cohorts over time asks whether each generation of customers retains better or worse than the last. A decline of two points here and three points there looks harmless in a single quarter, yet across eight quarters it can be devastating, and it usually appears well before the top line shows strain. A marketplace SaaS platform preparing for a $20M Series B faced exactly this scrutiny, and its cohort and unit economics models became the foundation of a defensible investor narrative.
Sales Productivity and Segment Design
Sales productivity tells the parallel story from the other side of the funnel. Adding reps and territory raises activity, but penetration is confirmed when revenue per rep rises because enablement is strong, the ideal customer profile is defined, and pricing matches value. Tracking ramp time, win rate, and quota attainment by hiring cohort often shows that reps placed in tighter, segmented territories outperform those in broad, undefined ones, which makes the difference a matter of design rather than hustle.
A professional services firm that grew from $12M to $63M in eight months showed the same pattern, since engagement-level profitability and utilization analytics gave leadership its first clear view of where margin was being created and where it was quietly leaking.
Building a Signal Dashboard
A signal dashboard is a quiet cluster of predictive metrics that are not shown to the street but function as heartbeat monitors for the business.
- Retention rate after month six
- Usage frequency variance
- Sales rep time to productivity
- Support ticket escalation rate
- Expansion pipeline conversion
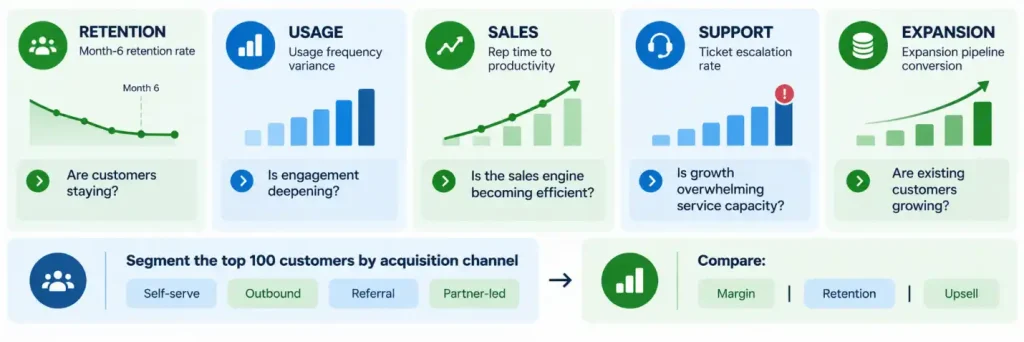
Segmenting the top 100 customers by how they arrived, whether self-serve, outbound, referral, or partner-led, and then comparing margin, retention, and upsell across those channels tends to produce a story quite different from the one told in board meetings. When a company triples in size and its NPS and upsell rates stall, the cause is often an onboarding model outpaced by growth, where customers disengage quietly rather than leave in anger.
The CFO as Strategic Storyteller in Market Penetration
There comes a moment, often unannounced and mid-quarter, when the models are sound, the dashboards are green, and a question remains in the air that no spreadsheet can resolve about whether the company is building something enduring or sprinting in place. Storytelling in this context is synthesis rather than sentiment, the ability to look across metrics, departments, and choices and explain why they matter and what must come next.
Dashboards are passive while dialogue is active, so finance must move planning sessions beyond asking what the CAC says toward asking what customer experience makes that CAC justifiable. Presenting two customers, one from an over-indexed segment and one from a market not yet understood, and tracing their onboarding, support, and expansion paths through the modeled curves can change how a boardroom hears the same data.
The Empty Slide Test
A useful exercise for emerging finance leaders is the Empty Slide Test, which imagines a single blank slide and only spoken words to fill it. The exercise forces a narrative connecting insight to decision, because data is the soil and the story is what grows from it.
Credible storytelling also requires proximity to the work. A finance leader who has built forecasting and reporting cadence from scratch, as in a cybersecurity SaaS company where actuals stayed within plus or minus five percent of forecast for eight consecutive quarters, speaks about the business with lived clarity. There will also be years when execution is flawless against the dashboard and targets are still missed, because the market shifted while assumptions stood still, and only honest narrative can reconcile that contradiction.
Three Key Takeaways
- A market penetration strategy should be judged by depth rather than visibility, using renewals, usage, and margin expansion to distinguish true embeddedness from presence.
- CAC, LTV, and payback period must be built from complete and conservative assumptions, since the composition of the ratio matters more than the ratio itself.
- Cohort curves, sales productivity by hiring cohort, and a signal dashboard reveal erosion early, and the CFO turns those signals into decisions by telling the story behind the numbers.
Disclaimer: This article is intended for informational purposes only and does not constitute legal, tax, or accounting advice. You should consult your own tax advisor or counsel for advice tailored to your specific situation.
Hindol Datta is a four-time CFO and senior finance executive with over 25 years of leadership experience across cybersecurity, SaaS, gaming, logistics, digital marketing, medical devices, consumer products, and nonprofit organizations. He has led more than $120M in fundraising and over $150M in M&A transactions while building the financial and operational systems that let complex businesses scale with confidence. He is the author of seven books in the Systems CFO Series and holds active CPA, CMA, and CIA credentials.
AI-assisted insights, supplemented by 25 years of finance leadership experience.