
Executive Summary
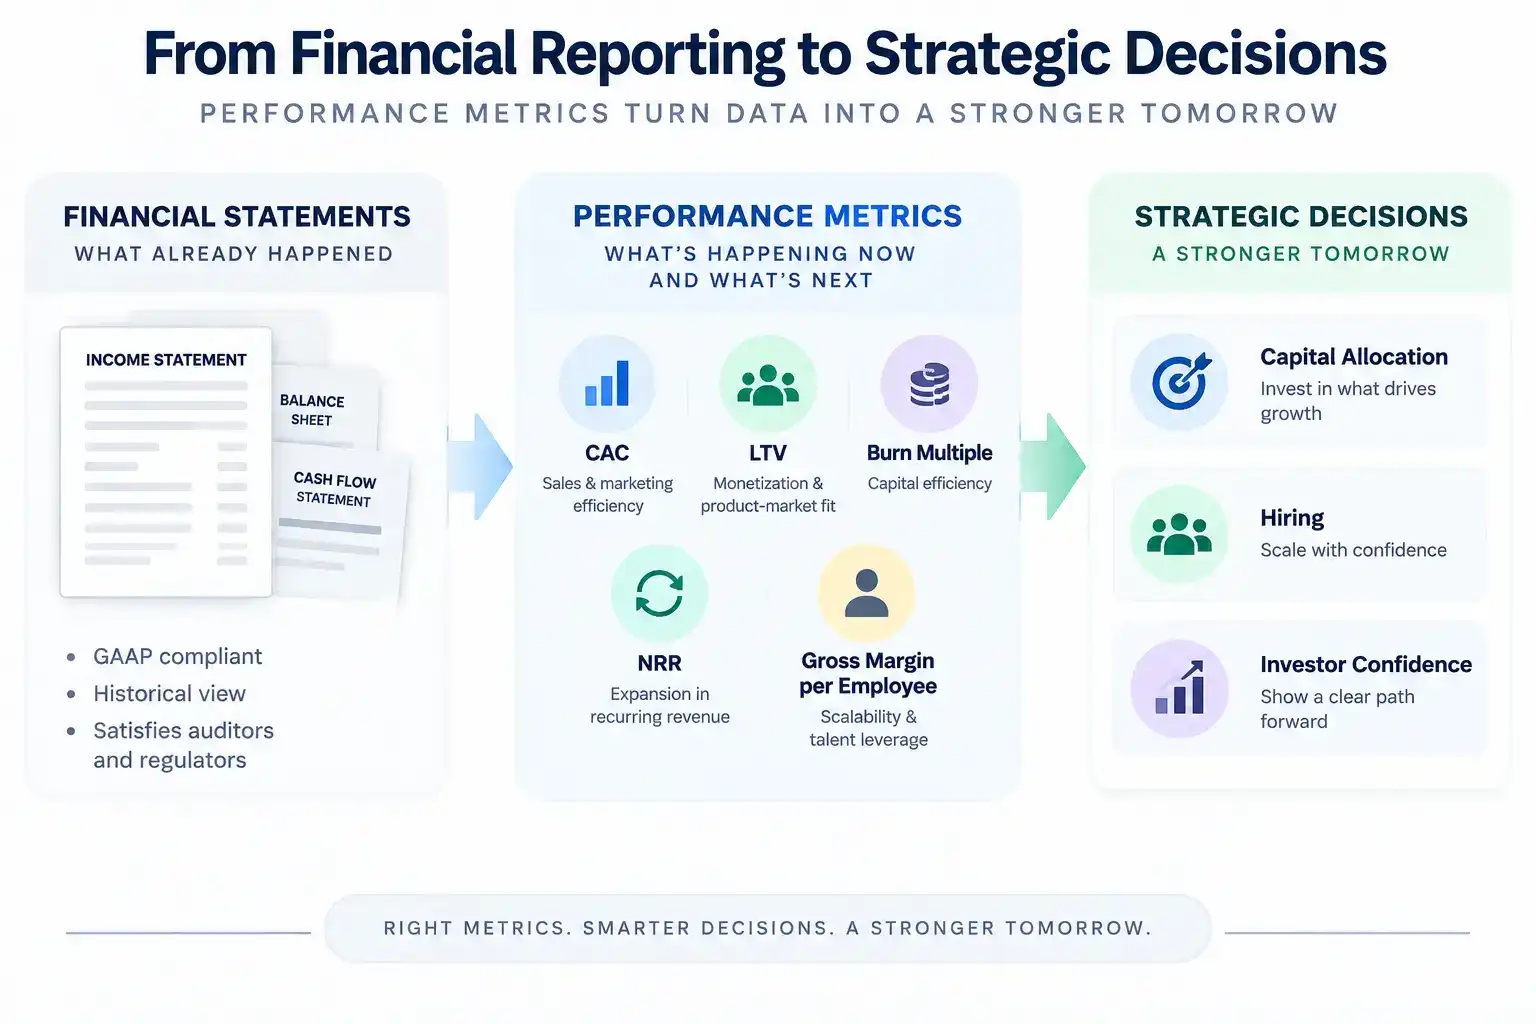
Companies that leverage metrics well do not just report clean books. They translate operational signals into strategic decisions faster than their competitors do. Financial statements tell a company what already happened. Performance metrics tell it what is happening now and what is likely to happen next, and that distinction shapes capital allocation, hiring, and investor confidence.
This guide covers why metrics matter more than compliance reporting alone, how to build a metric framework that fits a company’s stage and business model, how to embed those metrics into the reporting infrastructure so they actually get used, and how the CFO role shifts from scorekeeper to strategist once metrics become the operating language of the business.
Why Financial Statements Are Not the Strategy
A clean, GAAP-compliant income statement satisfies auditors and regulators. It rarely answers the question a sophisticated investor asks next: what is the CAC payback period trending toward after the latest go-to-market experiment? That gap between compliance reporting and performance reporting is where too many finance functions lose credibility.
GAAP revenue growth alone can mask a leaking bucket of customer churn or a shrinking gross margin per sales dollar. Performance metrics answer the questions that actually drive valuation and strategy.
Core Metrics Worth Tracking
- Customer Acquisition Cost (CAC): sales and marketing efficiency
- Lifetime Value (LTV): a proxy for monetization and product-market fit
- Burn Multiple: capital burned per incremental dollar of ARR
- Net Revenue Retention (NRR): the heartbeat of expansion in recurring revenue businesses
- Gross Margin per Employee: a signal of scalability and talent leverage
These metrics live at the intersection of CRM, billing, and operations data, not inside the general ledger. Finance’s job is to stitch them into a reliable, repeatable framework rather than leave them scattered across spreadsheets.
Compliance and Performance Reporting Compared
| Dimension | Compliance Reporting | Performance Reporting |
| Audience | Auditors, regulators, tax authorities | Board, investors, executive team |
| Framework | GAAP, IFRS, statutory | Internally defined KPIs and OKRs |
| Cadence | Monthly, quarterly | Weekly, biweekly, or real-time |
| System source | ERP, general ledger | CRM, billing, analytics layer |
| Objective | Accuracy, auditability | Decision enablement, forward visibility |
Metrics Are Contextual, Not Universal
No single metric stack applies to every company. An early-stage biotech company lives and dies by runway and milestone tracking. A direct-to-consumer brand obsesses over blended ROAS and SKU-level contribution margin. The right metric framework depends on both the stage of the company and its underlying business model.
How Metrics Evolve by Stage
Business Model Shapes the Metric Stack
- SaaS businesses emphasize NRR, CAC, churn, and LTV, with close attention to bookings versus billings timing
- E-commerce and D2C brands track gross margin after shipping, contribution margin per SKU, blended ROAS, and inventory turns
- Biotech and hardware companies focus on R&D burn trajectory, milestone-based capital planning, and regulatory or time-to-market metrics
A three-tier metric stack keeps this organized. Strategic metrics such as burn multiple and ARR growth belong at the board level. Operational metrics such as CAC and NRR drive mid-level execution. Tactical metrics such as cost per lead or ticket backlog guide daily team management. A useful stack also balances lagging indicators like revenue against leading indicators like weekly demo-to-deal ratios, since leading indicators give teams time to correct course before results show up in the financials.
Embedding Metrics Into the Reporting Infrastructure
Designing the right metrics is only half the work. They need to live inside a reporting architecture that makes them timely, trustworthy, and tied to real decisions, not just another chart added to the board deck.
Closing the Gap Between FP&A and Actuals
FP&A teams often build sophisticated forecasts that go stale the moment actuals arrive in a disconnected ERP system. Linking planning and actuals dynamically lets the board see how CAC trends affect runway in real time, and lets sales leadership see how quota attainment moves the burn multiple.
Building the Feedback Loop
- Real-time dashboards that reflect current performance across key financial and operational dimensions
- Forecast overlays that explain variance, such as a CAC miss driven by a channel mix shift rather than a market slowdown
- Cadenced reviews, whether monthly or even weekly, where leadership aligns on metric trends before they harden into results
A short weekly review focused on just a handful of core metrics, such as ARR growth, CAC, NRR, and a product engagement index, tends to turn those numbers into muscle memory within a few weeks. Once that cadence sets in, strategic conversations start referencing the metrics naturally instead of debating what they mean.
Creating a Single Source of Truth
When sales, marketing, and finance each calculate CAC differently, confusion and mistrust follow. A metrics playbook that defines the formula, the data source, the refresh cadence, the owner, and the intended audience for each metric removes that ambiguity, so leadership debates what a number implies rather than how it was built.
Cross-Functional Ownership
Finance typically builds the dashboards, but marketing owns CAC inputs, product owns retention signals, and sales owns quota attainment. Assigning a metric steward in each department, and tying shared OKRs to metric improvement, turns the dashboard into a genuine collaboration tool rather than a finance-only artifact.
From Scorekeeper to Strategist: The CFO’s Expanding Role
Financial leaders were traditionally expected to explain what already happened: why margins compressed, why SG&A grew faster than revenue. That explanatory function is now the minimum bar. CFOs who leverage metrics well are expected to explain where the company is heading and what needs to change to bend that trajectory.
A single metric like NRR looks backward on its surface, but in practice it signals product stickiness, customer success alignment, and pricing discipline all at once. Interpreting metrics like this, rather than simply reporting them, is what separates a scorekeeper from a strategist.
A CFO who narrates a board meeting through deal cycle length, blended acquisition cost, onboarding efficiency, and cohort NRR builds a different kind of confidence than one who opens with a static financial summary. Reducing shared cross-department OKRs down to a handful of sacrosanct metrics, such as LTV, CAC, NRR, burn multiple, and a product activation rate, tends to reduce internal debate over whose numbers are right and redirect that energy toward strategy instead.
Investors notice this fluency directly. A CFO who can explain a two-point gross margin drop with precision signals command of the business; one who cannot invites doubt regardless of how clean the GAAP numbers look. That said, metrics simplify reality by design, and a disciplined CFO treats them as a map rather than the territory itself, supplementing them with qualitative judgment before letting any single number dictate a decision.
Three Key Takeaways
- GAAP tells a company what already happened. Performance metrics tell it what is happening now and what is likely to happen next, which is why companies that leverage metrics well make faster, better-informed decisions.
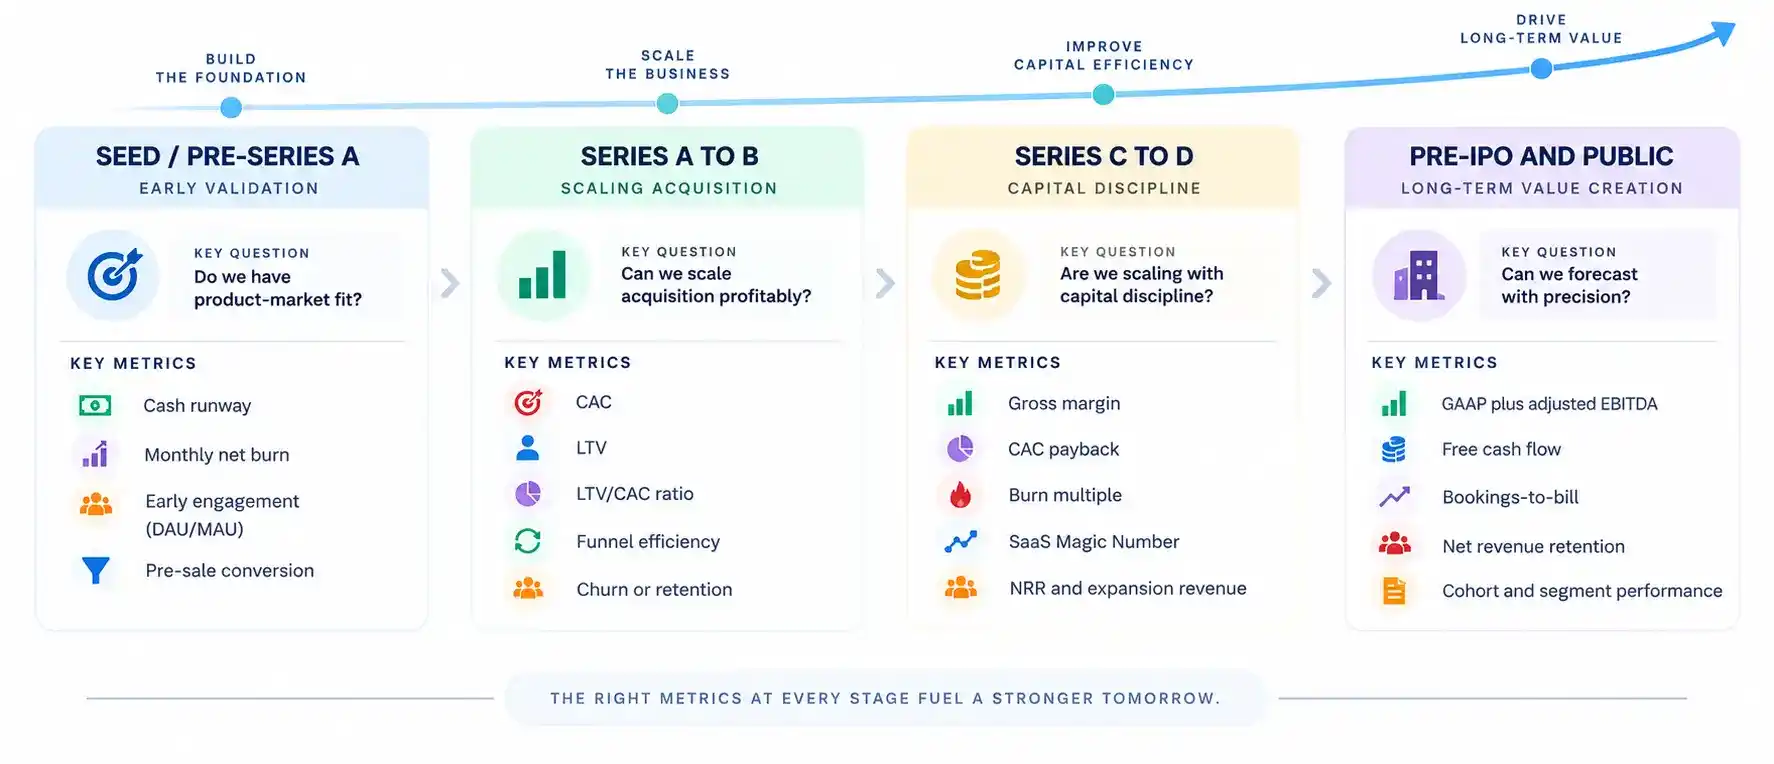
- No universal metric stack exists. The right metrics depend on company stage, from runway and engagement at seed through free cash flow and bookings-to-bill pre-IPO, and on the underlying business model.
- Metrics only create value once they are embedded into real reporting infrastructure: a single source of truth, a cadenced review, and cross-functional ownership that turns numbers into decisions rather than slides.
Disclaimer: This article reflects general professional perspectives on financial reporting practice. Readers should consult their own financial, legal, or tax advisors before applying these concepts to their own organization.
Hindol Datta is a four-time CFO and senior finance executive with over 25 years of leadership experience across cybersecurity, SaaS, gaming, logistics, digital marketing, medical devices, consumer products, and nonprofit organizations. He has led more than $120M in fundraising and over $150M in M&A transactions while building the financial and operational systems that let complex businesses scale with confidence. He is the author of seven books in the Systems CFO Series and holds active CPA, CMA, and CIA credentials.
AI-assisted insights, supplemented by 25 years of finance leadership experience.