
Executive Summary
Key metrics in private equity do far more than fill quarterly reports. TVPI, DPI, IRR, MOIC, and their companions shape how firms raise capital, earn carry, and build credibility with limited partners, yet each one tells only part of the story.
This article explains what the core private equity metrics reveal, how to calculate each one with worked examples, and why eight of them deserve the closest attention. The aim is to help finance leaders read fund performance as a connected narrative about time, risk, and value rather than a scattered list of ratios.
Why Key Metrics in Private Equity Shape Firm Identity
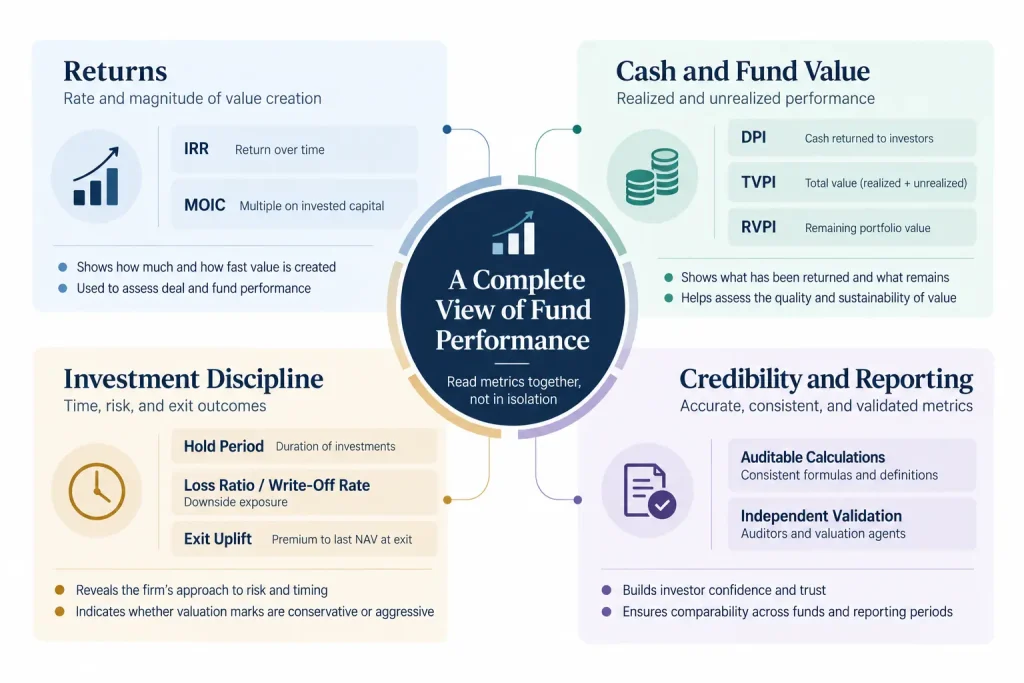
Private equity trades in confidence as much as capital, and durable confidence rests on measurement. Firms raise funds on the promise of their numbers, earn carry on the reality of them, and build identity on the discipline those numbers enforce. The strongest firms go further and understand what each of the key metrics in private equity reveals about strategy.
The Foundational Trio: TVPI, DPI, and IRR
These three measures form the base of fund performance analysis, and each speaks to a different dimension of value:
- TVPI (Total Value to Paid-In) captures the multiple on invested capital, both realized and unrealized, and serves as the long-term compass.
- DPI (Distributions to Paid-In) measures cash returned and answers the limited partner’s most immediate question about money received.
- IRR (Internal Rate of Return) introduces time, showing how fast value arrived as well as how much.
IRR stands apart because timing distortions affect it heavily. A fast partial exit can inflate IRR while reducing long-term DPI, so the three metrics only make sense when read together.
RVPI and the Question of Unrealized Value
Residual Value to Paid-In (RVPI) captures the unrealized portion of the portfolio and becomes central in mid-life funds, where exits have not yet crystallized value. It measures potential rather than outcome, which also makes it the metric most vulnerable to overstatement. A fund with high RVPI and low DPI may carry strong NAV marks but little cash, and investors should ask whether that value is real or simply deferred.
Gross Versus Net Private Equity Returns
At the asset level, Gross MOIC and Gross IRR reflect underlying deal quality before fees and carry. Comparing them across deals reveals dispersion, and narrow dispersion signals consistent underwriting while wide dispersion may point to dependence on one or two winners. Due diligence on an IT services acquisition showed how quickly reported earnings can diverge from economic reality, which is why deal-level gross figures deserve the same scrutiny as the headline fund number.
Net IRR and Net MOIC, adjusted for fees and carry, tell the investor’s story. Gross metrics help assess skill, but net metrics build trust, and a firm that delivers 2.0x net MOIC and 20%+ net IRR across cycles demonstrates discipline as well as talent.
Operational, Risk, and Business Model Metrics
A complete view of key metrics in private equity extends beyond return multiples into pace, risk posture, and the firm’s own economics:
- Capital Deployment Rate tracks the velocity of investment, where moving too fast can compromise underwriting and moving too slowly creates cash drag.
- Hold Period reveals duration sensitivity, since a firm running five-year holds optimizes differently from one running seven-year holds.
- Exit Uplift, the premium to last NAV at exit, shows whether valuation marks lean conservative or aggressive.
- Loss Ratio and Write-Off Rate signal realism about risk rather than simple failure.
- Management Fee Ratio shows whether fees cover operations or whether the platform depends on ever-larger fund sizes.
- ESG and operational KPIs, such as EBITDA margin improvement, revenue CAGR, and carbon intensity, turn value creation plans into measurable progress.
Unit economics work offers a useful parallel for these private equity metrics. At a venture-backed digital marketing company that scaled from $9M to $180M in 24 months, CAC, LTV, and contribution margin discipline sustained growth in the same way operational KPIs sustain value creation inside a portfolio company. Sustainable PE firms apply that same scrutiny to their own P&L.
How to Calculate Private Equity Metrics
Precision in calculating private equity metrics underpins investor confidence, fund governance, and internal decisions. The table below sets out each formula, using a single example fund that has contributed $250M, distributed $200M, and holds $100M in NAV.
Private Equity Metrics Formula Reference
| Metric | Formula | Worked Example |
| TVPI | (Residual Value + Distributions) / Paid-In Capital | ($200M + $100M) / $250M = 1.2x |
| DPI | Cumulative Distributions / Paid-In Capital | $200M / $250M = 0.8x |
| RVPI | Residual Value / Paid-In Capital | $100M / $250M = 0.4x |
| Gross MOIC | Total Value from Investment / Invested Capital (pre-fees) | $90M / $30M = 3.0x |
| Net MOIC | Total Net Proceeds to LP / Paid-In Capital | $60M / $30M = 2.0x |
| Gross and Net IRR | Discount rate at which NPV of all dated cash flows equals zero | Calculated with Excel XIRR |
| Capital Deployment Rate | Total Capital Invested / Investment Period | $300M / 36 months = $8.3M per month |
| Hold Period | Exit Date minus Initial Investment Date | Expressed in years or months |
| Exit Uplift | (Exit Price minus Last NAV) / Last NAV | ($50M minus $40M) / $40M = 25% |
| Loss Ratio | Total Capital Lost / Total Capital Invested | Losses are deals below 0.5x or written off |
| Write-Off Rate | Deals Written Off / Total Deals | Count-based measure |
| Management Fee Ratio | Total Management Fees / Commitments or AUM | Tests scalability and cost structure |
| EBITDA Margin | EBITDA / Revenue | Rolled up from portfolio companies |
| Revenue CAGR | (Exit Revenue / Entry Revenue)^(1/Years) minus 1 | Rolled up from portfolio companies |
| Carbon Intensity | Emissions / Revenue or Emissions / Unit | Tracked under SASB or GRI frameworks |
The example also confirms a useful identity, since TVPI always equals DPI plus RVPI. For IRR, capital calls enter as negative cash flows and distributions as positive ones, with gross IRR using deal-level flows and net IRR using LP-level flows after fees. ESG reporting can add measures such as the share of companies with DEI policies, board gender diversity, and improvement in energy usage.
Building Auditable Metric Models
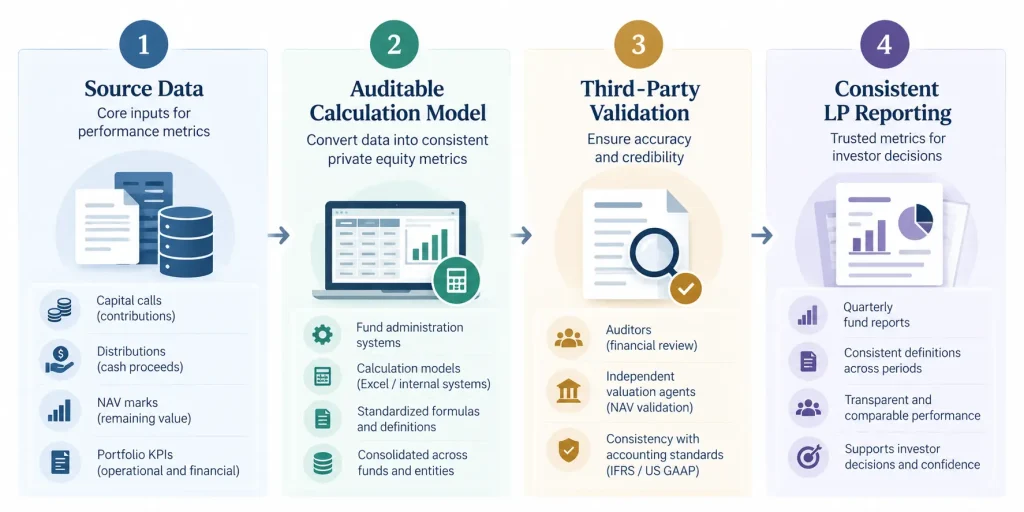
Every calculation should live in an auditable model, whether that sits on a fund administration platform, in structured Excel, or in purpose-built analytics tools. Metrics must stay consistent across quarters, trace back to source data, and hold up to review by third-party auditors or valuation agents. Building consolidated reporting across five countries under both IFRS and US GAAP for a publicly listed gaming company showed how much investor trust depends on a single, consistent definition of each number.
Eight Key Metrics in Private Equity That Define Stewardship
Among all key metrics in private equity, eight align most closely with the architecture of private equity investing. Each reflects a different aspect of performance, whether speed, magnitude, endurance, prudence, or fortitude.
Return Metrics: IRR, MOIC, and DPI
IRR expresses return as a single rate across uneven cash flows, which makes it compelling and risky in equal measure. An early partial exit can inflate IRR while suppressing true return, so it works best as one perspective rather than a final verdict.
MOIC ignores time entirely and asks how much came back for what went in. Gross MOIC informs underwriting quality at the asset level, while net MOIC delivers the investor’s real outcome at the fund level, leaving little room for illusion.
DPI measures cash returned, not modeled exits or theoretical value. For limited partners, it marks the point where projected value becomes bankable, and it forces the GP to reconcile aspiration with realization.
Value Metrics: TVPI and RVPI
TVPI unites realized and unrealized value and offers a holistic view for mid-life funds. A high TVPI built on fragile NAVs, however, deserves skepticism, and it only commands confidence when DPI rises alongside RVPI.
RVPI reflects the GP’s conviction about what remains in the portfolio. If those marks drift too far from market reality, the fund risks appearing insincere as well as imprudent, so valuation must stay tethered to credible evidence.
Discipline Metrics: Hold Period, Loss Ratio, and Exit Uplift
Hold period does not measure return, but it governs the cadence of returns. A short hold may lift IRR while a longer one may deepen MOIC, and when value creation demands transformation, time becomes a resource to deploy rather than a cost to minimize.
Loss ratio reveals risk posture in an industry that tends to celebrate only success. A firm with zero losses may be timid rather than brilliant, while tolerable losses alongside outsized winners can indicate a calculated thesis executed well.
Exit uplift shows whether marks reflected humility or hubris. Selling above last NAV demonstrates conservatism and execution, while selling below raises questions about marking discipline. Staffing a finance and audit committee during a $37M capital raise at a mission-driven education institution reinforced how closely boards and investors watch the gap between reported value and realized value.
Three Key Takeaways
- Key metrics in private equity only tell the truth when read together, because IRR, DPI, TVPI, and RVPI each capture a different dimension of time, cash, and value.
- Rigorous, auditable calculation of every private equity metric, validated by third parties and consistent across quarters, is the foundation of limited partner trust.
- Hold period, loss ratio, and exit uplift reveal a firm’s discipline and judgment as clearly as return figures reveal its results.
Disclaimer: This article is intended for informational purposes only and does not constitute legal, tax, or accounting advice. You should consult your own tax advisor or counsel for advice tailored to your specific situation.
Hindol Datta is a four-time CFO and senior finance executive with over 25 years of leadership experience across cybersecurity, SaaS, gaming, logistics, digital marketing, medical devices, consumer products, and nonprofit organizations. He has led more than $120M in fundraising and over $150M in M&A transactions while building the financial and operational systems that let complex businesses scale with confidence. He is the author of seven books in the Systems CFO Series and holds active CPA, CMA, and CIA credentials.
AI-assisted insights, supplemented by 25 years of finance leadership experience.