
Executive Summary
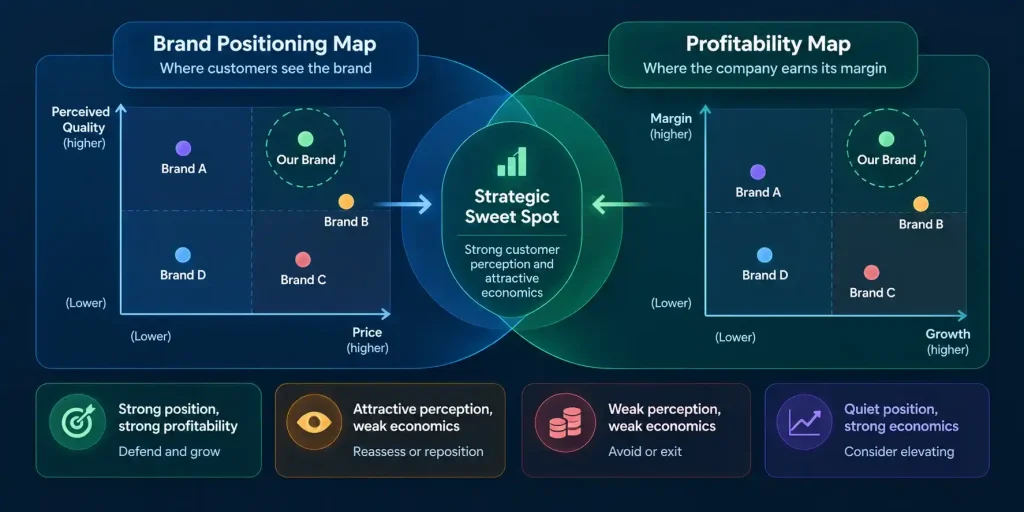
A brand positioning map shows where a company stands in the minds of customers, usually plotted on axes such as price and perceived quality. Marketing teams rely on it to find open space and to separate the brand from competitors. Yet a map built only on perception can mislead leaders when it ignores where the company earns its margin.
The sections ahead connect the brand positioning map to a profitability map, starting with how to build that profitability view with precision. They then cover how margin data reshapes the company’s story, which trade-offs follow, and how the market reads positioning. The final section explains how the CFO leads when the map disagrees with long-held beliefs. Together they show that durable positioning rests on economic truth as much as on customer perception.
Why a Brand Positioning Map Needs a Profitability Lens
A positioning map in marketing typically plots competitors on two dimensions customers care about, such as price versus quality or convenience versus customization. That view answers an important question about perception. It does not answer whether the space the brand occupies is one where the company can make money.
Two Maps, One Strategic Question
A profitability map plots business units, products, customer segments, or regions against dimensions such as margin, growth, and capital intensity. When leaders overlay it on the brand positioning map, a sharper picture emerges. Some positions that look attractive in customer research turn out to drain capital. Meanwhile, some quiet corners of the portfolio prove to be the true center of value.
Brand Positioning Map Versus Profitability Map
| Dimension | Brand Positioning Map | Profitability Map |
| Core question | How do customers see the brand? | Where does the company earn its margin? |
| Typical axes | Price, quality, convenience, innovation | Margin, growth, capital intensity, cost to serve |
| Primary owner | Marketing | Finance |
| Main risk | Claiming space the business cannot sustain | Ignoring perception that drives future demand |
Market positioning concerns how the company wins, not only where it plays. Profitability acts as a signal of fit between offering and audience, cost and value, identity and intention. The combined view lets leaders step into markets where their capabilities shine and retreat from those where they merely persist.
Building a Profitability Map With Precision
Most profitability maps fail before anyone draws the first axis. The cause is seldom missing data; it is imprecise questions. Leaders must decide whether to measure contribution margin or fully loaded cost, and how to assign overhead by headcount, revenue, or strategic weight.
Unbundling Segments and Tracing True Cost
Every company faces a temptation to flatten its data by assigning costs broadly and grouping SKUs loosely. That shortcut protects the old model at the expense of learning. A credible profitability map requires several disciplines from finance and operations:
- Unbundle segments so each revenue stream carries its real burden
- Trace costs as they exist today, not as they existed when the segment launched
- Include cost to serve, support load, and systems effort alongside direct costs
- Invite sales, operations, and product leaders to explain anomalies the numbers hide
The most dangerous segment on any map is not the one that loses money. It is the one that makes money for the wrong reasons, such as margin borrowed from another unit. Deferred upgrades and under-resourced service can also prop up economics that look healthy. A proper map exposes the product line that dazzles in revenue but sinks in return on capital. It also exposes the region whose volumes win praise while its logistics costs erode value.
A $127M global consumer products company selling through DTC, Amazon, and wholesale channels shows the value of this precision. SKU rationalization, demand planning, and logistics optimization more than doubled inventory turns from 3x to 7x. Clear segment-level economics made each of those portfolio decisions possible.
Mapping also needs a steady rhythm instead of a single annual exercise. Costs evolve, preferences shift, and a map that was accurate last year can mislead by spring.
How Profitability Reshapes the Brand Story
Companies tell stories to the market and to themselves, and leaders often find the inward ones harder to change. Repeated at board meetings and town halls, they become part of the corporate identity. Then a profitability map arrives and the old story begins to splinter.
From Legend to Pattern
The segment once called the growth engine may prove to be underperforming. A unit described as foundational may consume value instead of creating it. Leaders often defend the old story by citing identity or untapped potential. Such responses usually signal grief more than argument.
The CFO cannot force the story to change but can insist that the numbers be heard. Repositioning in this sense is translation, not erasure. Something once called core may become heritage, and a quiet, margin-rich corner may emerge as the true center of gravity. A brand positioning map built on that recognition aligns marketing claims with the economic truth of the enterprise.
A professional services firm with five business units offers a useful example. Engagement-level profitability and utilization analytics, built from scratch, revealed where the business created margin and where it leaked. Leadership could then shift emphasis toward the services that earned real returns.
Making the Trade-Offs That Positioning Requires
Reading a profitability map is one task, and acting on it is another. Most positioning efforts fail in the discipline of departure, not in the drawing of insight. Maps point to where the company could go and to where it no longer belongs.
Choosing Terrain and Letting Go
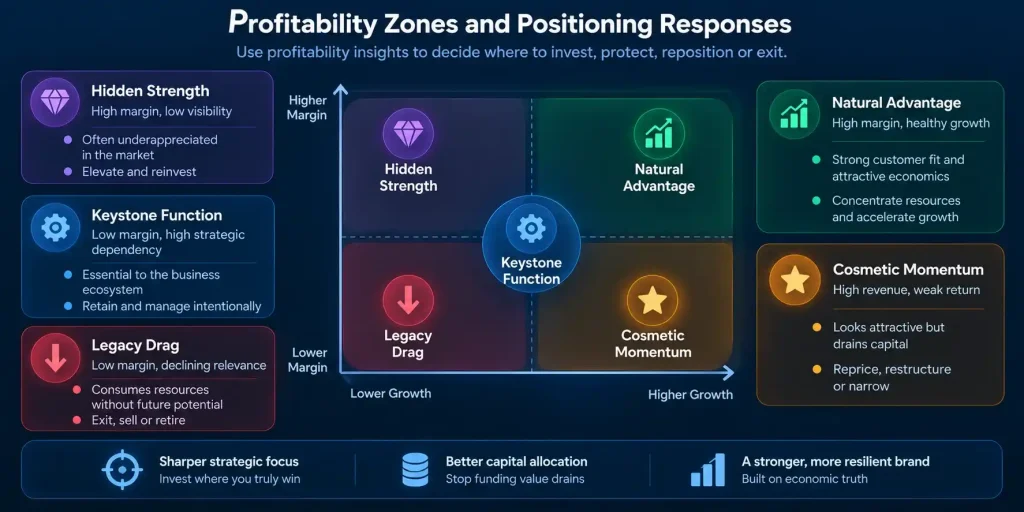
The firms that command both price and identity are clear about what they do not do. Using the profitability map alongside the brand positioning map, leaders can sort the portfolio into a few broad zones.
Profitability Zones and Positioning Responses
| Zone | Profitability Signal | Positioning Response |
| Natural advantage | High margin and healthy growth | Concentrate talent, capital, and brand emphasis |
| Hidden strength | High margin, low visibility | Elevate in messaging and reinvest |
| Cosmetic momentum | High revenue, weak return on capital | Reprice, restructure, or narrow scope |
| Keystone function | Low margin, high strategic dependency | Keep with stated intent and a known cost |
| Legacy drag | Low margin and declining relevance | Exit, sell, or retire with care |
Some low-margin businesses hold the enterprise together in ways a map cannot measure. Leaders who keep such units must do so with intention, explain why, and carry the cost openly. In every other case, delay after the truth is clear amounts to avoidance with better manners.
Without trade-offs, every positioning effort becomes a performance. When capital keeps flowing toward legacy lines and the comfortable middle, the firm survives but drifts. The CFO must name the cost of fragmentation and channel capital toward the few places where the company’s edge is real.
Using the Map to Shape External Perception
Investors and competitors understand a company better than its leaders often assume. They watch what the company funds, not only what it says. Over time, they discern its priorities because the company underwrites them.
Positioning That the Market Can Read
Many companies hesitate to speak about profitability with any specificity. Naming high-margin areas feels like inviting competition, and naming weak ones feels like admitting failure. In practice, transparency often builds strength, because it shows that the company is not confused and does not hide behind volume.
Profitability logic can shape external positioning in several ways:
- Earnings calls that emphasize margin-accretive segments and explain capital choices
- Sales conversations that match the brand positioning map to where margin is natural
- Investor materials that link asset mix, talent focus, and capital allocation to one story
- Pricing that reflects proof of fit instead of defensive discounting
A marketplace SaaS company with operations in the United States and Poland shows how coherent economics build credibility. Cohort and unit economics models, along with consolidated cross-border reporting, anchored investor diligence during a $20M Series B. Investors trusted the positioning because the numbers behind it were consistent.
Competitors also read these signals with close attention. When a firm concentrates in profitable zones, rivals often retreat from marginal fights or rethink pricing. In this way, a well-supported positioning map in marketing becomes a form of deterrence built on visible conviction.
The CFO as Cartographer of the Brand Positioning Map
Drawing a profitability map is easier than leading through it. Every firm has legends, such as a founding product, an iconic client, or a flagship region. These legends live in recruiting, branding, and culture, yet they are not always economically real.
Leading When the Map Disagrees With the Myth
Spreadsheets offer little help when the map shows that a beloved engine has stalled. The CFO must hold the pen as a chronicler, naming what the data shows with care instead of cruelty. Behind every underperforming segment sits someone’s labor and legacy, and economic correction is not a judgment of character.
One useful question can reframe a tense executive discussion: does the team love the business, or the memory of it? Repositioning that follows such a question works best when it moves with care. Teams reshape the segment, migrate talent, realign systems, and retire the myth with dignity.
Early-stage experience as an operations controller at a $170M medical device manufacturer with sites in Copenhagen, Cork, and Taiwan reinforced this discipline. Standard costing and bill-of-materials work there showed how product-level economics often differ from how customers perceive a product. That gap is what a brand positioning map paired with a profitability view helps leaders close.
Three Key Takeaways
- A brand positioning map shows how customers see the company, and pairing it with a profitability map shows whether that position is worth holding.
- Precise profitability maps unbundle segments, trace true cost, and reveal trade-offs that leaders must act on instead of postponing.
- When positioning reflects real economics, a positioning map in marketing builds investor trust and deters competitors. It also helps the CFO lead the company toward where it truly wins.
Disclaimer: This article is intended for informational purposes only and does not constitute legal, tax, or accounting advice. You should consult your own tax advisor or counsel for advice tailored to your specific situation.
Hindol Datta is a four-time CFO and senior finance executive with over 25 years of leadership experience across cybersecurity, SaaS, gaming, logistics, digital marketing, medical devices, consumer products, and nonprofit organizations. He has led more than $120M in fundraising and over $150M in M&A transactions while building the financial and operational systems that let complex businesses scale with confidence. He is the author of seven books in the Systems CFO Series and holds active CPA, CMA, and CIA credentials.
AI-assisted insights, supplemented by 25 years of finance leadership experience.