


Executive Summary
Over three decades of steering financial operations, I have learned to trust patterns more than predictions, systems more than snapshots, and questions more than answers. Revenue is the emergent property of an interconnected web of people, processes, and signals. One of the most misunderstood among these signals is the Net Promoter Score. The real value of NPS lies not in the score but in its integration into a broader feedback system. On its own, it is a dot. Connected with churn data, cohort behavior, and LTV calculations, it becomes a constellation. In a well-tuned revenue operation, deal desk surfaces friction signals back into sales playbooks. Sales flags product misfits to marketing. Marketing diagnoses acquisition cost anomalies by source. When these loops are closed, revenue becomes predictable. I advocate for triangulating feedback: combine NPS with support ticket data, product usage telemetry, and qualitative verbatims. Then run correlation analyses to separate signal from noise. Revenue operations, when orchestrated well, becomes the metronome of the organization. It synchronizes intent with execution. It turns insights into outcomes.
The Map is Not the Territory, But the Patterns Are Telling
From the outside, revenue operations appear deceptively linear: leads flow to sales, deals get structured, contracts are signed, and revenue materializes. But from the inside, especially when viewed through the lens of systems thinking, the reality is far more entangled. Revenue is not the product of isolated events. It is the emergent property of an interconnected web of people, processes, and signals. One of the most misunderstood among these signals is the Net Promoter Score.
When Fred Reichheld first introduced the Net Promoter Score, it offered a simple question with purportedly predictive power: how likely are you to recommend this product or service to a friend or colleague? As a CFO with deep roots in data science and systems theory, I see the appeal. NPS is compact. It is comparable. And it claims correlation with growth. But simplicity can mislead. In practice, NPS is riddled with biases, selection, response, and context, all of which distort its signal. A high NPS from a narrowly selected sample may obscure systemic weaknesses. Conversely, a low NPS spike during a transitional quarter may trigger an overreaction.
The real value of NPS lies not in the score but in its integration into a broader feedback system. On its own, it is a dot. Connected with churn data, cohort behavior, and LTV calculations, it becomes a constellation. And in business, constellations guide better than stars.
Revenue Operations as a Living System
To make NPS actionable, I treat it as part of a diagnostic suite, never as a solitary metric. I have seen dashboards celebrate a high NPS quarter while quietly bleeding renewals through the back door. So I ask: who responded, and why? What is the churn rate of detractors versus passives? Are promoters driving referrals?
In a well-tuned revenue operation, deal desk surfaces friction signals back into sales playbooks. Sales flags product misfits to marketing. Marketing diagnoses acquisition cost anomalies by source. When these loops are closed, revenue becomes predictable.
Revenue Operations as Interconnected Feedback Loops
This diagram illustrates the shift from a traditional linear pipeline to a living feedback system. In the linear model, each function hands off to the next with no reverse information flow. In the living system model, every touchpoint generates signals that flow backward and forward across nodes. Deal desk logs friction and sends it to sales. Sales flags product misfits to marketing and product. Finance correlates NPS with churn and feeds insights back to all teams. When these loops close, the organization learns continuously and revenue becomes predictable through adaptation rather than static execution.
Understanding NPS: The Metric Behind Loyalty
Net Promoter Score is a widely used metric that measures customer loyalty and satisfaction. It is based on a single question: how likely are you to recommend our company, product, or service to a friend or colleague? Customers respond on a scale of 0 to 10, where:
- 0 to 6 are Detractors: Unhappy customers who may damage your brand through negative word-of-mouth.
- 7 to 8 are Passives: Satisfied but unenthusiastic and vulnerable to competitive offerings.
- 9 to 10 are Promoters: Loyal enthusiasts who will keep buying and refer others.
The formula is straightforward:
NPS = % of Promoters minus % of Detractors
For example, if you survey 100 clients and 60 respond with 9 or 10, 20 respond with 7 or 8, and 20 respond with 0 to 6, then Promoters equal 60 percent, Detractors equal 20 percent, and NPS equals 60 minus 20, which is plus 40. NPS is expressed as an integer between minus 100 and plus 100.
NPS Interpretation and Benchmarks
| NPS Score | Interpretation | Action Required |
| +70 and above | World-class | Maintain and amplify best practices. Study promoters for expansion signals. |
| +50 to +69 | Excellent | Systematize what works. Identify detractor patterns for elimination. |
| +30 to +49 | Good, above average | Focus on converting passives to promoters. Reduce detractor root causes. |
| 0 to +29 | Acceptable, room to improve | Deep-dive into feedback. Correlate NPS with churn and usage data. |
| Below 0 | Problematic | Customer loyalty at risk. Immediate intervention required across product and service. |
Benchmarks vary by industry. For IT services, managed IT services typically score 30 to 50, enterprise SaaS scores 20 to 40, cloud infrastructure scores 30 to 60, and IT consulting scores 20 to 35. Context matters. A plus 35 score in IT services may represent strong performance in a complex B2B environment with longer sales cycles and implementation complexity.
Measuring Customer Health Holistically
Trend is more valuable than a single score. Look for movement over time by segment, geography, product line, or delivery team. Segment by customer type. Large enterprise versus SMB. New versus long-term. Different user personas yield different loyalty signals. Cross-tabulate NPS with churn. Are detractors more likely to churn or downgrade? Are promoters expanding faster? Track NPS before and after key touchpoints such as onboarding, support cases, renewals, or project delivery completion. Tie NPS to behavioral metrics. Usage frequency, feature adoption, and support responsiveness often correlate with NPS trajectory.
As CFO, I care deeply about LTV, CAC, and churn. But I have learned that these metrics, while vital, are retrospective. They tell me what did happen. What I often seek is an early signal of what will happen. This is where survey data, if used judiciously, enters. When the Chief Revenue Officer scores accounts not just by ARR but also by sentiment, usage frequency, and service responsiveness, we begin to build a real-time risk radar. Suddenly, the account with growing ARR but declining engagement becomes visible before it becomes a headline churn.
I advocate for triangulating feedback. Combine NPS with support ticket data, product usage telemetry, and even qualitative verbatims. Then run correlation analyses to separate signal from noise. It is not enough to know that a customer is unhappy. We must know what kind of unhappiness predicts risk.
Churn Rate by Customer Segment and NPS Category
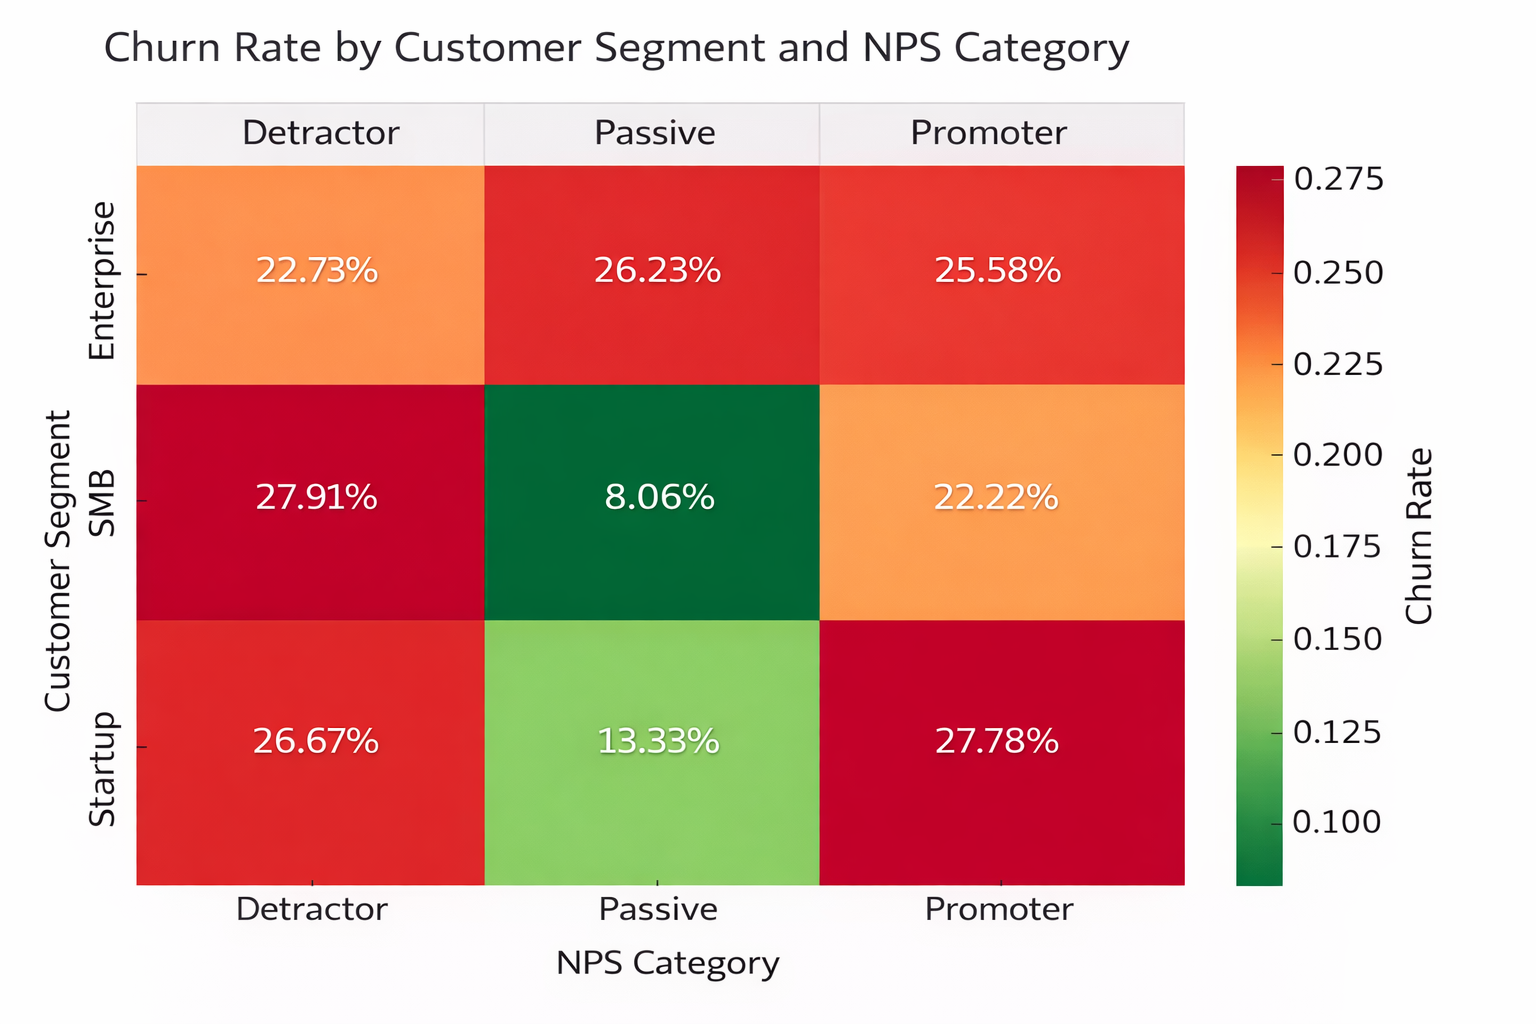
This heatmap illustrates churn rate by customer segment and NPS category. As expected, Detractors show significantly higher churn rates across all segments, with SMB Detractors churning at 27.91 percent. Promoters consistently exhibit the lowest churn in the Enterprise segment at 25.58 percent, though notably all Enterprise customers show elevated churn regardless of NPS category. Passives fall in between, with SMB Passives showing remarkably low churn at 8.06 percent. The Startup segment shows the most volatility, with Promoters churning at 27.78 percent despite high satisfaction scores. This view helps prioritize interventions: target Detractors in the SMB segment for retention, investigate why Enterprise customers churn regardless of satisfaction, and reinforce what is working with SMB Passives.
Average LTV by Customer Segment and NPS Category
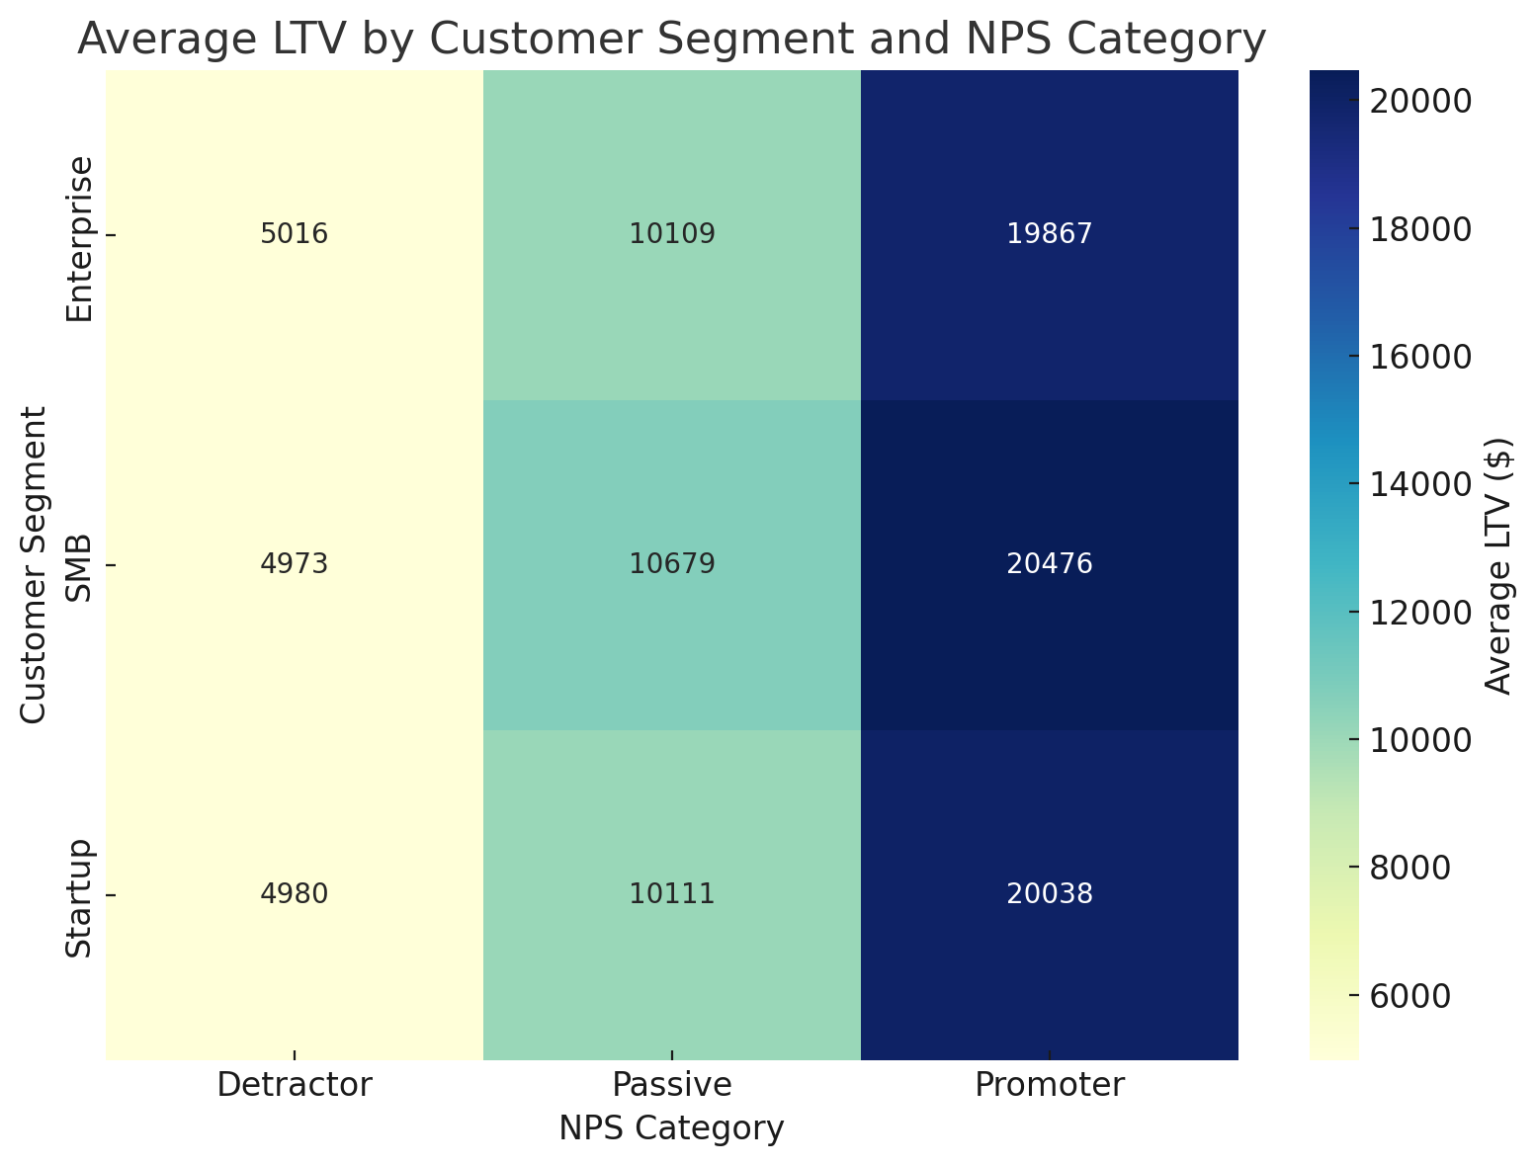
This heatmap visualizes average Lifetime Value across customer segments and NPS categories. Key insights: Promoters consistently deliver the highest LTV across all segments. SMB Promoters generate $20,476 compared to just $4,973 for SMB Detractors, more than 4x the value. Enterprise and Startup Promoters show similar patterns with LTV near $20,000. Detractors across all segments cluster around $5,000 in LTV, while Passives sit in the middle at roughly $10,000 to $10,700. This layered view of NPS to churn to LTV is foundational for revenue strategy. The data reveals that even in segments with higher overall churn like Enterprise, Promoters still deliver nearly 4x the lifetime value of Detractors, making loyalty programs and proactive engagement with high-NPS accounts a clear ROI driver.
In one instance, we discovered that a certain type of negative comment pertaining to billing transparency correlated more strongly with churn than general dissatisfaction. That insight did not come from intuition. It came from regression.
In one SaaS transformation I led, we rewired our quote-to-cash engine to not only streamline contracting but also to capture structured feedback at each step. Deal desk logged the number of iterations per contract. Sales recorded the type of pricing objections. Finance tracked cycle time drift. Each touchpoint became a sensor, not just a transaction. The result was not just faster deals. It was better segmentation, more intelligent bundling, and ultimately higher gross margin.
The Role of Deal Desk: Guardian of Frictionless Value
A well-run deal desk is not a bureaucratic bottleneck. It is the neural bridge between finance, sales, and product strategy. It does not just apply guardrails. It feeds intelligence back into product-market fit.
We have institutionalized this by enabling dynamic rule engines that adjust pricing tiers based on regional win-loss analysis. When sales leaders see that Latin American enterprise wins spike with a particular bundling strategy, that rule is codified into our CPQ system. Conversely, when discounts rise but win rates do not, we pause and analyze.
In one engagement, a tangled quote-to-cash process delayed deal closure by over three weeks on average. We dismantled that structure by embedding intelligence into the system. We implemented pre-approved clause libraries, dynamic discounting thresholds, and contract scorecards based on deal complexity. Median cycle time dropped 42 percent in two quarters, and trust among teams increased.
Designing for Decision Quality, Not Just Efficiency
Most operational frameworks aim for efficiency. They standardize inputs, reduce steps, and automate decisions. But in environments characterized by uncertainty, efficiency without context becomes fragility. I advocate instead for designing systems that optimize decision quality.
This begins with instrumentation. Just as pilots rely on cockpit telemetry, revenue leaders need dashboards that are not just pretty. They need to be predictive. This means going beyond lagging metrics like bookings and instead embracing leading indicators: opportunity velocity by segment, time-in-stage by sales rep, forecast accuracy over trailing periods, and even email sentiment analysis in customer success.
In one company, we discovered that deals with more than two rounds of redlining on indemnity clauses were three times more likely to churn within a year. That insight came from statistical tagging of contract terms and linking that with customer health metrics downstream. We integrated that insight into our deal desk playbook. Deals with multiple legal escalations now trigger proactive onboarding support and periodic QBRs. Churn in that cohort dropped 18 percent year over year.
It is tempting to treat Net Promoter Score as a north star. But in practice, it is closer to a weather vane. It shifts with timing, sampling, and context. What matters is not the absolute score but the delta, the change over time within comparable cohorts. We began treating NPS as a vector, not a scalar. Rather than obsessing over whether our score was 57 or 68, we studied trajectory. Did the NPS for our largest segment improve post-onboarding? Did regional NPS correlate with local support responsiveness?
We also paired NPS with behavioral telemetry. When usage of a specific reporting feature increased, NPS rose predictably within 60 days. That feature became a proxy for customer value realization. We doubled down on its UX, added onboarding tutorials, and proactively encouraged its adoption. The impact was reduced churn and higher expansion bookings. If NPS is the voice of the customer, usage data is the body language. When the two align, the story is trustworthy. When they diverge, it is a call to investigate.
Designing a Strong NPS Survey
A good NPS survey does two things. It captures the quantitative score and it asks why in an open-ended follow-up. Here is how to structure it:
- Start with the Core NPS Question: On a scale of 0 to 10, how likely are you to recommend our company to a friend or colleague?
- Ask for Qualitative Feedback: What is the primary reason for your score? This helps contextualize sentiment and identify recurring themes such as communication, expertise, or timeliness.
- Add Optional Diagnostic Questions: To enrich insights, add questions such as how would you rate our technical expertise, how responsive is our team to your needs, how easy is it to do business with us, and what could we do better to improve your experience? These questions should use Likert scales and should be optional to encourage higher response rates.
Sales Operations: Where Discipline Meets Storytelling
Sales operations must balance precision with narrative coherence. Sales teams need clarity on quotas, territories, and incentives. But they also need to understand why the company is focusing on a particular ICP, why a pricing tier matters, and why win-loss trends inform strategy.
Revenue operations becomes credible when it serves both sides of the brain. It delivers data with integrity and offers frameworks for action. We built a Deal Confidence Index that aggregated stage progression, CRM hygiene, past win-rates by rep, and product match score. This was not just a forecasting tool. It was a coaching tool. Reps began to see their pipeline as a learning portfolio. Sales leaders appreciated the visibility. Finance appreciated the predictability.
Conclusion
What I have come to believe across years of scaling businesses and restructuring operations is that strategy is not a static plan. It is an emergent outcome of sensing, learning, and adapting. The organizations that thrive do not just execute well. They listen better. They close feedback loops faster. And they treat each touchpoint not just as a transaction but as a data-bearing event.
Revenue operations, when viewed through this lens, becomes a force multiplier. It connects disciplines, collapses silos, and tunes the organization to act as a single adaptive organism. In that context, NPS is no longer a vanity score. It is a directional antenna. Over the years, I have come to see the CFO role not merely as custodian of financials but as steward of the system. Finance sits at the confluence of truth and trust. We see patterns before others do because the numbers always whisper first.
In a world increasingly shaped by complexity, ambiguity, and noise, our greatest edge is not certainty. It is adaptiveness. And the organizations that master this will not just grow. They will endure.
Disclaimer: This blog is intended for informational purposes only and does not constitute legal, tax, or accounting advice. You should consult your own tax advisor or counsel for advice tailored to your specific situation.
Hindol Datta is a seasoned finance executive with over 25 years of leadership experience across SaaS, cybersecurity, logistics, and digital marketing industries. He has served as CFO and VP of Finance in both public and private companies, leading $120M+ in fundraising and $150M+ in M&A transactions while driving predictive analytics and ERP transformations. Known for blending strategic foresight with operational discipline, he builds high-performing global finance organizations that enable scalable growth and data-driven decision-making.
AI-assisted insights, supplemented by 25 years of finance leadership experience.